# GitHub Octoverse 2026:开发活动创新高,超 40% 的 PR 由智能体起草
> 原标题:Octoverse: Commits, pushes, reach new highs in 2026 as developers build with agents
- 来源:GitHub Blog
- 发布时间:2026-10-28T16:07:40.000Z
- AIHOT:https://aihot.news/items/s3m3uzabqoxxed9ae50b73qvc
- 原文:https://github.blog/news-insights/octoverse/octoverse-commits-pushes-reach-new-highs-in-2026-as-developers-build-with-agents/
## 摘要
GitHub 发布 2026 年度 Octoverse 报告:过去 12 个月开发者推送代码 179 亿次,超过 2024 和 2025 年之和,合并 PR 达 13 亿次。
## 推荐理由
GitHub 用自家遥测数据量化了智能体参与开发的程度,从 PR 占比、模型轮换到行业分布都给出可核对的数字。
## 正文 · 中文译文
过去 12 个月,开发者向 GitHub 推送代码 179 亿次,超过 2024 年和 2025 年的总和。
这个数字背后,是开发者在构建自己感兴趣、也是社区需要的东西。在尼泊尔,一位开发者[在 GitHub Pages 上搭建了一个洪水公告板](https://github.com/nirajbhusal/rasuwa-flood-bulletin),提供经过核实的道路、救援、天气和电力信息。它后来发展成了 [Gati](https://github.com/nirajbhusal/gati-alerts),一个以尼泊尔语优先、转发官方灾害警报的服务,运行在 GitHub Pages 和 Actions 上。在其他地方,NASA 喷气推进实验室的开发者正在开发[用于在航天器上运行程序的软件](https://github.com/nasa/spacewasm),爱好者们则[构建了开源固件,让人们可以自定义自己的电子阅读器](https://github.com/crosspoint-reader/crosspoint-reader)。好奇心指向四面八方,规模之大是 GitHub 前所未见的。
这种增长来得很快。年中时,GitHub 上的活动急剧上升,恰逢智能体从开发者尝试的东西变成了与之并肩工作的东西。开发者可选择的模型比以往任何时候都多,并投身于本报告首次重点呈现的各个行业,从医疗保健到农业。
Octoverse 是我们退后一步、纵览全局的机会。今年,这幅图景比以往任何时候都更大。以下是最引人注目的几点:
- **更多 AI,一切都在增多。**在今年创建的仓库中,带有智能体配置文件的平均仓库提交次数是不带该文件的新仓库平均值的八倍。
- **截至 9 月,开发者发起的拉取请求中超过 40% 由智能体开始。**3 月时这一比例为 17%。对于越来越多的工作而言,第一步现在是指挥智能体,而审查则是开发者塑造返回结果的方式。
- **开发者在模型选择上行动迅速。**9 月,61% 的 GitHub Copilot 用户使用了不止一个模型,请求分布在通用、深度推理与规划、以及快速轻量模型之间
- **构建者来自各个领域。**今年,我们首次按行业分享对公共仓库的观察。服务于采矿、建筑、医疗保健和农业的仓库自 2022 年以来各自增长了好几倍。
在这一切之下,AI 模型及其周围的运行框架在过去一年里不断进步,开发者的选择也更多了。增长正在快速推进:去年发布的五年开发者增长预测才过一年,我们预测的每个国家都已走完通往 2030 年至少五分之一的距离,而我们自己的预测模型对下一步走向已不再一致。
## 开发者创下新节奏的一年
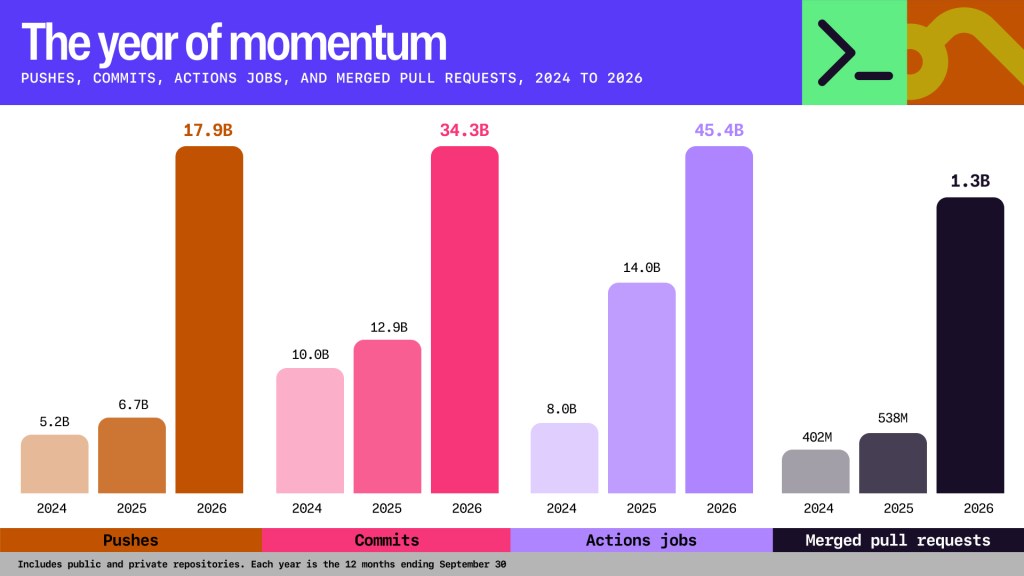
今年的一切都关乎势头。过去 12 个月,开发者向 GitHub 推送代码变更 179 亿次,超过 2024 年和 2025 年的总和。所有仓库类型(公共和私有)的提交次数增长更快,达到 343 亿次,是两年前的三倍多。同期合并的拉取请求增长了两倍多,达到 13 亿个,平均每天 350 万个。
智能体是开发者今年最倚重的工具之一,它们让开发者更深入地融入日常工作。在今年创建的仓库中,带有智能体配置文件的平均仓库提交次数是不带该文件的新仓库平均值的八倍,这表明从第一天起就用智能体构建的个人和团队正以明显不同的节奏前进。
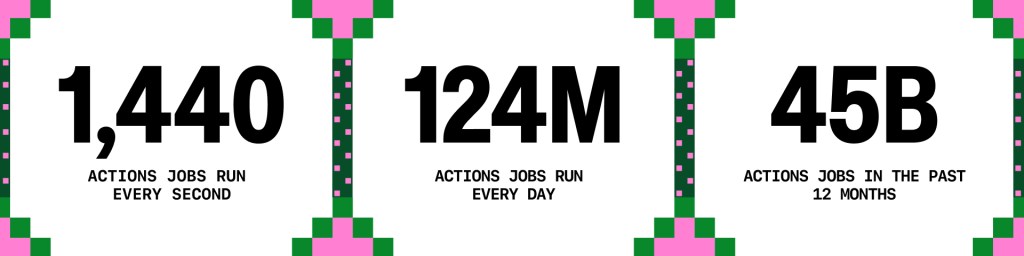
开发者还依赖自动化来推动项目持续运转。今年 GitHub Actions 每秒运行 1,440 次作业。这相当于每天 1.24 亿次,是去年总量的三倍多。开发者合并了超过 3,000 万个 Dependabot 拉取请求,以保持依赖项最新并减少已知漏洞的使用,约为 2025 年速度的两倍。
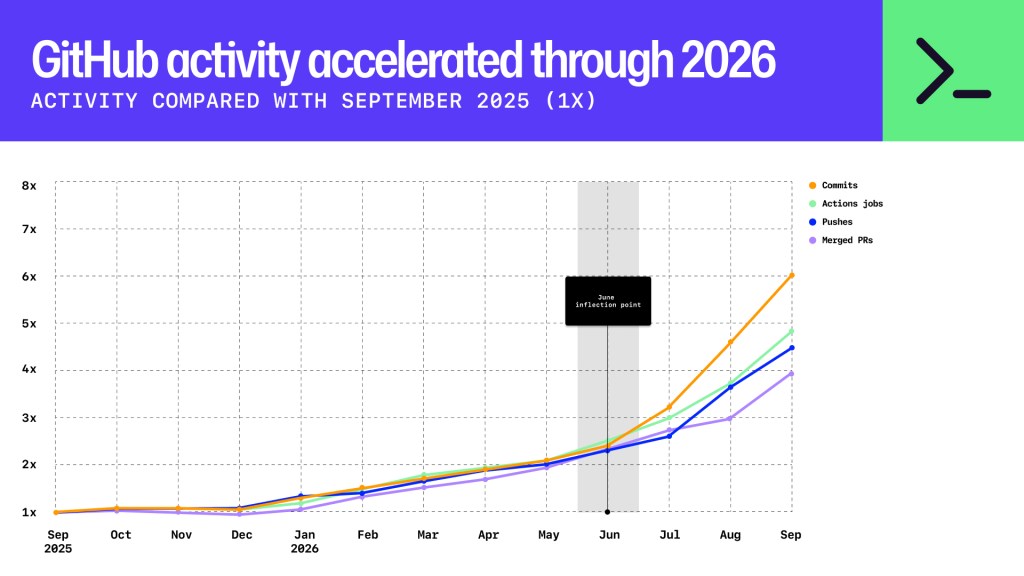
我们的遥测数据显示,活动从 1 月起稳步攀升,随后在 6 月前后激增,仿佛各地的开发者同时看到了新的可能性。大约就在那时,一系列行业范围的转变同时发生:更强大的底层模型、围绕它们构建的框架与工具,以及运行在两者之上的智能体。智能体从单会话工具转变为持久化工具,能够跨天跟踪进度并编排其他专用智能体。同样重要的是,智能体开始大量使用云端,既在本地机器上执行工作,也能远程执行。
这一势头既体现在全新的仓库中,也来自已构建多年的开发者。从 6 月起,约 55% 的提交来自全新仓库。但还有更多提交来自已活跃一段时间的开发者:过去 12 个月内推送过代码的开发者平均已在 GitHub 上活跃 36 个月,而在 8 月提交过拉取请求的开发者中,超过 75% 在 9 月推送了代码。他们也在不断扩展:如今普通开发者所参与的仓库数量比一年前多了 10%。
这种持续投入也体现在开源领域。2026 年公开贡献飙升至 25 亿次,是去年总量(11.2 亿次)的两倍多。这些数字背后是持续投入的开发者,例如 [@kinlane,](https://github.com/kinlane) 他通过智能体工作流在自己的公开仓库中做出了超过 100 万次贡献,以保持一份机器可读的公开 API 信息目录始终最新。另一个例子是 [@kim-em](https://github.com/kim-em),他在维护 mathlib(一个由计算机校验的数学社区库)期间做出了超过 178,000 次贡献。[@andig](https://github.com/andig) 是开源电动汽车充电控制器与家庭能源管理系统 [evcc](https://github.com/evcc-io/evcc) 的维护者,贡献超过 21,000 次。
这些只是数百万开发者每天所做工作中的几个例子。致所有从事此类工作以及更多工作的开发者:我们看到了你们,也很高兴你们在构建。
## 开发者正在更多地方进行构建
本报告中的每一个数字背后都是一位开发者。GitHub 目前服务超过 2.25 亿开发者,社区正在全球范围内增长。美国(3,830 万)和印度(3,200 万)仍是两大开发者社区,今年各新增超过 1,000 万名开发者。巴西今年在 GitHub 上新增 328 万名开发者,在各国中排名第三。
| **国家** | **2026 年 9 月 GitHub 上的开发者总数** |
| --- | --- |
| 美国 | 3,830 万 |
| 印度 | 3,200 万 |
| 中国 | 1,240 万 |
| 巴西 | 1,020 万 |
| 日本 | 715 万 |
| 英国 | 647 万 |
| 印度尼西亚 | 634 万 |
| 德国 | 630 万 |
| 俄罗斯 | 507 万 |
| 法国 | 475 万 |
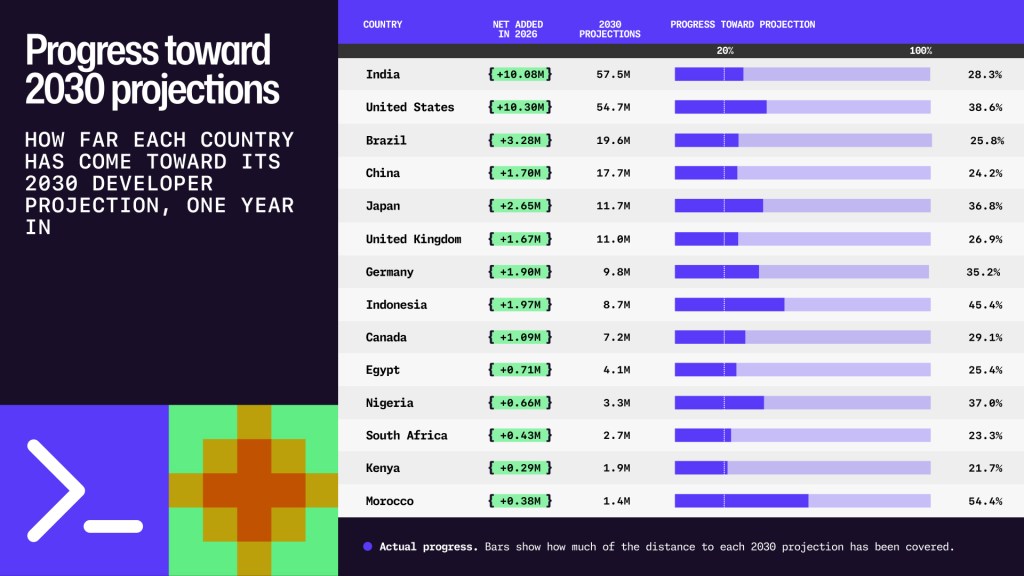
去年,我们预测到2030年印度开发者数量将达到5750万,美国将达到5470万。在这个五年窗口期过去一年后,我们预测中的每个国家都已走完通往其2030年目标数字至少五分之一的距离。美国已完成38.6%,印度完成28.3%。
同样的势头在各地区都有体现,每个地区都有其自身的本地背景:
| **地区** | **增长驱动力** | **市场背景** |
| --- | --- | --- |
| 美洲 | 金融科技与数字支付 | • **巴西**:成熟且快速增长的金融科技行业
• **加拿大**:稳定的人工智能与软件投资 | | 欧洲、中东和非洲 | 制造业与初创企业中的AI应用。非洲快速增长的开发者社区 | • **摩洛哥**:金融科技与初创企业生态
• **德国**:其工业核心地带的企业级AI应用
• **法国和西班牙**:AI与深科技初创企业
• **肯尼亚、尼日利亚、南非**:金融科技、农业科技与编程训练营 | | 亚太 | 政府对AI基础设施和人才的投资 | • **印度尼西亚**:蓬勃发展的数字经济
• **日本**:AI基础设施投资
• **韩国**:政府支持的AI人才项目
• **澳大利亚**:AI、机器学习与数据技能 | 一年过去,增长相对于去年的预测表现强劲,而预测未来五年正变得越来越难。我们将40多个预测模型推演至2031年,这些基于历史注册和使用数据构建的时间序列与回归模型各自假设了不同的增长速度。约一半模型预测“极端”增长,即到2031年GitHub上的开发者数量将增长两倍以上。略低于一半的模型预测“大幅”增长,即增长一到两倍。只有三个模型预期接近温和增长,即低于2倍。 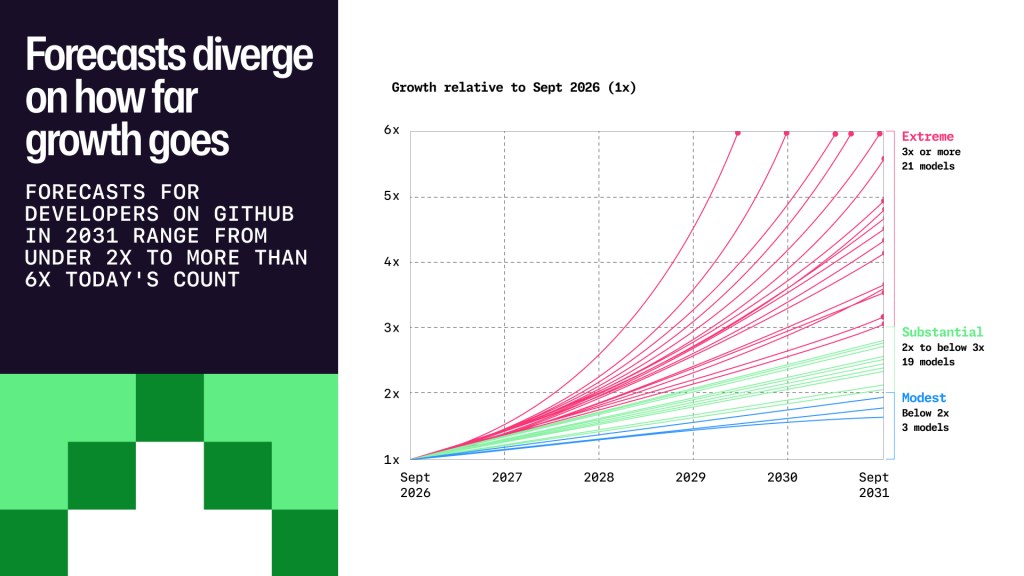 预测只是估计,如此大的分布差异表明2026年的激增在多大程度上拓宽了到2031年的可能区间。保持不变的是趋势的形态:开发者社区正在更多地方同时增长。 ## 未来正在各地构建 在过去的报告中,“各地”意味着更多开发者和更多国家,例如在向公共仓库贡献代码的头部国家这一语境下: ##### 按个人资料所在地调整后,向公共仓库推送次数排名前10的国家 | **排名** | **国家** | | --- | --- | | 1 | 美国 | | 2 | 印度 | | 3 | 中国 | | 4 | 巴西 | | 5 | 德国 | | 6 | 英国 | | 7 | 韩国 | | 8 | 法国 | | 9 | 日本 | | 10 | 加拿大 | 今年,它还意味着更多领域,包括我们此前未曾测量的行业。 我们使用北美行业分类系统(NAICS)来分享我们对各行业公共仓库的看法,该系统将经济活动划分为多个部门。一个语言模型对2022年至2026年每年创建的公共仓库随机样本进行分类,根据其名称、描述、主题和README将每个仓库归入其所服务的行业。我们还追踪了两个信号:仓库是否提及AI,以及是否有智能体对其发起过拉取请求。 这两个信号并不总是同步变化。在行政与支持服务、采矿、医疗保健和农业领域,超过四成的代码仓库提及 AI,但由智能体发起的拉取请求却很少,不到 3%。建筑业打破了这一模式。其约四分之一的仓库提及 AI,但约 9% 拥有由智能体发起的拉取请求,是所有行业中占比最高的,制造业紧随其后。 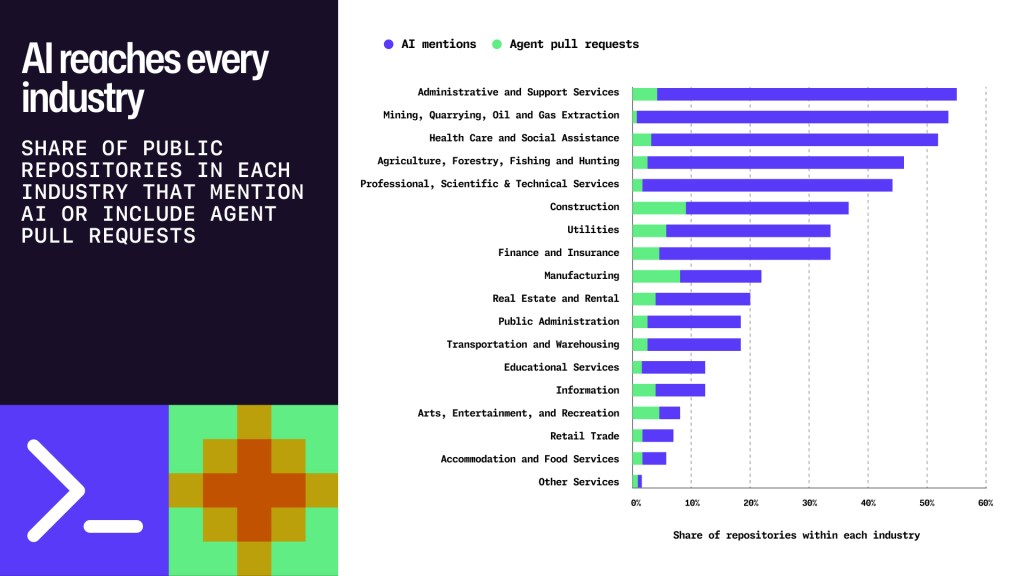 同一分类还显示了自 2022 年以来各行业的足迹如何变化,而且远不止软件行业的领域正在攀升。专业、科学和技术服务业在所有行业中从第四位升至第二位,仅次于信息业。农业、林业、渔业和狩猎业上升两位,金融与保险业以及医疗保健和社会援助业各上升一位。以各行业自身 2022 年的基线衡量,采矿、采石以及石油和天然气开采业从较小的起点增长了约 65 倍,行政与支持服务业和建筑业增长了 17 至 18 倍,即便是其中增长最慢的制造业也几乎增长了两倍。 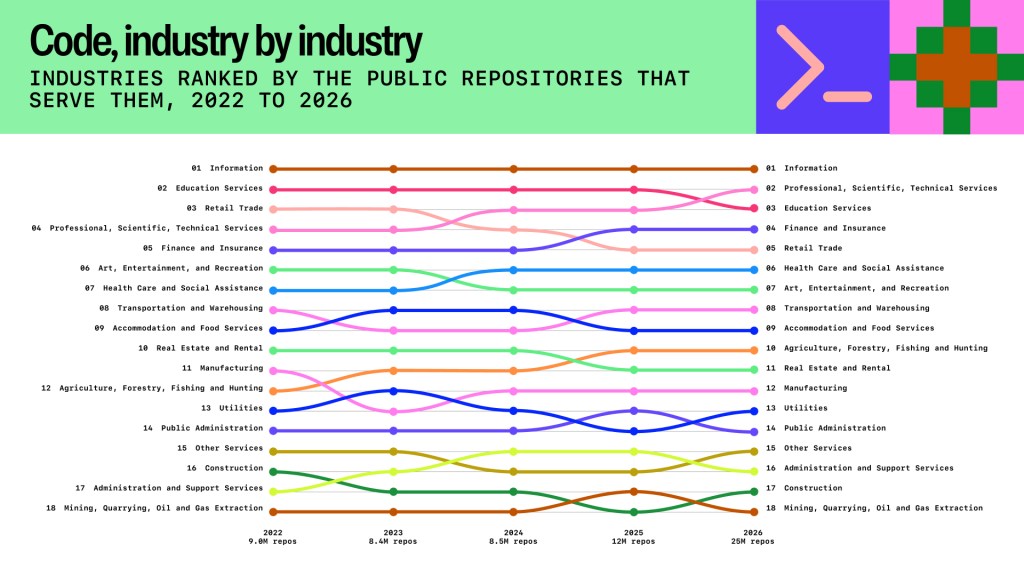 这些行业变化的背后,是了解自身领域的人们如今正使用 AI 编程智能体来构建。例如,在制造业,一个小团队构建了一种方法,[将你的工具照片转化为定制贴合、可 3D 打印的抽屉收纳盒](https://github.com/tracefinity/tracefinity)。医疗保健领域的一个研究实验室让科学家更容易[分析组织样本的大型数字扫描图像](https://github.com/rendeirolab/wsidata),也就是病理学家研究疾病时所查看的那类图像。在哥本哈根,一个大学实验室构建了一条[流水线,用于对鸡玩耍的视频进行分类,从嬉戏到追逐虫子](https://github.com/sbhattlab/PlayClass)。怀卡托大学的一个能源中心构建了一套[工具包,帮助工业工厂找到可再利用的热量](https://github.com/waikato-ahuora-smart-energy-systems/OpenPinch),保加利亚数字部开源了一个[门户网站,任何人都可以追踪谁赢得了公共合同以及金额多少](https://github.com/midt-bg/sigma)。对于写作者,一位小说家构建了一款[免费应用,让你在打字时手稿看起来就像一本书](https://github.com/hughhowey/neo)。在一个又一个领域,最接近问题的人正在构建解决方案,智能体一路提供帮助。 专业、科学和技术服务业较其自身 2022 年基线增长了约 5 倍,并攀升至第二位,其工作是研究、工程和咨询,而开放代码长期以来一直是这类工作完成方式的一部分。在生物化学领域,[AlphaFold](https://github.com/google-deepmind/alphafold) 背后的工作为 Demis Hassabis 和 John Jumper 赢得了 2024 年诺贝尔化学奖的一部分。在计算机科学领域,[Tensor2Tensor](https://github.com/tensorflow/tensor2tensor) 伴随了引入 Transformer 的论文,这一架构正是当今大语言模型的基础,即[《Attention Is All You Need》](https://arxiv.org/abs/1706.03762)。在医学领域,[sars-cov-2-stability](https://github.com/dylanhmorris/sars-cov-2-stability) 保存了关于病毒在空气和表面存活多久的最早论文之一的代码和数据。在物理学领域,[eht-imaging](https://github.com/achael/eht-imaging) 是用于重建[首张黑洞图像](https://arxiv.org/abs/1906.11241)的两个开源库之一。一个代码仓库已悄然成为已发表研究背后论文记录的一部分。 ## 开发者正在重塑他们的工作流程 如今更多开发者开始一个拉取请求时,会先说明他们想要什么,并编排执行该任务的智能体。到 2026 年 9 月,GitHub 上超过 40% 的拉取请求以智能体的初稿开始,高于 3 月的 17%。仅 9 月就有 1.1 亿个,约为 3 月数量的 6 倍。 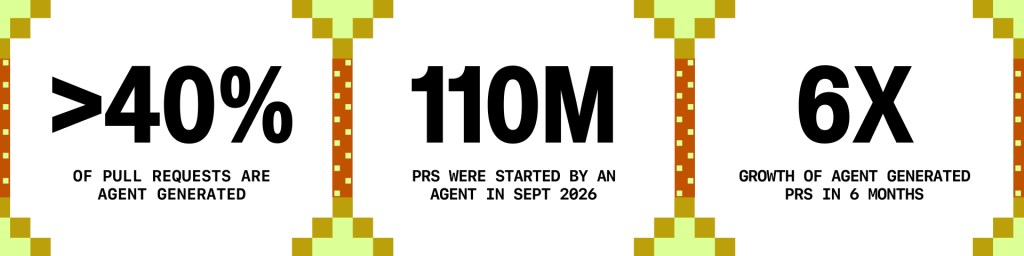 由 Agent 发起的拉取请求也更常改动多个文件:约 87%,而未检测到 Agent 参与的拉取请求为 79%。它们的合并速度也很快。2 月,83% 的 Agent 参与拉取请求在两周内合并,略低于未检测到 Agent 参与的拉取请求约 86% 的比例。到 9 月,Agent 拉取请求达到 90%,而对照组保持在约 86%。 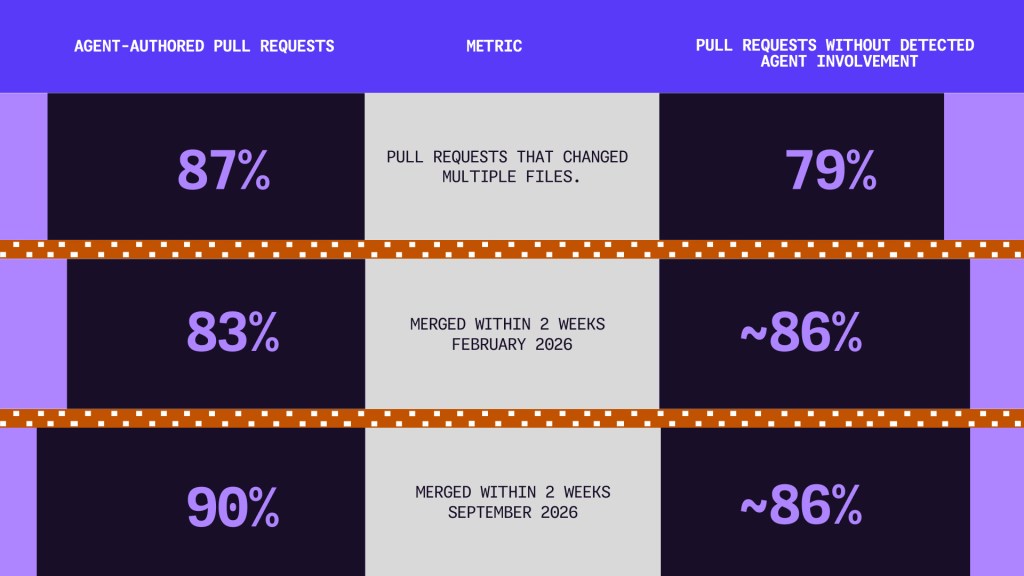 在 GitHub Copilot 的月活跃用户中,55% 现在使用 Agent 功能,高于一年前的 35%。增长最陡峭的是最省心的模式。Copilot cloud agent 由开发者分配任务、Agent 独立完成,同比增长 230%,而 Agent 聊天为 85%。开发者仍会向 Agent 提问,并且越来越多地把整个任务交给它。 这种委托意愿体现在开发者尝试的任务类型上。提及互操作性或逆向工程的公共仓库同比增长超过 300%,从 2025 年创建的约 30,000 个增至 2026 年的超过 130,000 个。 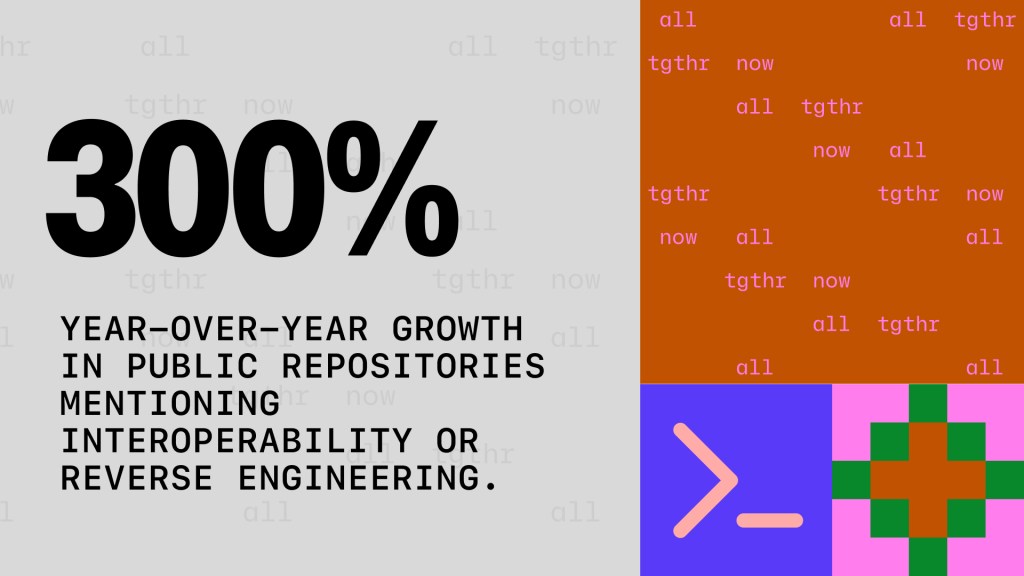 审查是开发者塑造返回结果的环节,为此正在构建更多工具。[堆叠拉取请求](https://docs.github.com/pull-requests/how-tos/stacked-pull-requests?utm_source=octoverse-pr-stacks-docs&utm_medium=blog&utm_campaign=universe-2026)将相关工作拆分为更小、便于按顺序审查的变更,于 7 月 30 日推出预览版,到 9 月已有超过 264,000 名开发者使用。AI 辅助代码审查和 GitHub Advanced Security 的使用量均同比增长超过 90%。该平台还帮助保护这些工作:推送保护会筛查 API 密钥和密码等泄露的机密,今年运行了 58 亿次扫描,接近 2025 年速度的四倍。开发者正在加大对代码审查方式的投入。 ## 模型选择以开发者的速度变化 开发者根据交给 Agent 的工作来匹配模型。2026 年 9 月,自行选择模型的 GitHub Copilot 用户中,61% 在会话中使用了不止一个模型,高于四个月前的 50%。 可选模型也在增多:付费 GitHub Copilot 计划上的开发者在 5 月使用了 29 个不同模型,9 月使用了 47 个,当月没有任何单一模型的请求占比超过 25%。一些模型选择取决于成本和熟悉度。开发者会权衡价格和功能与需求,并可能倾向于他们已经信任的提供商。 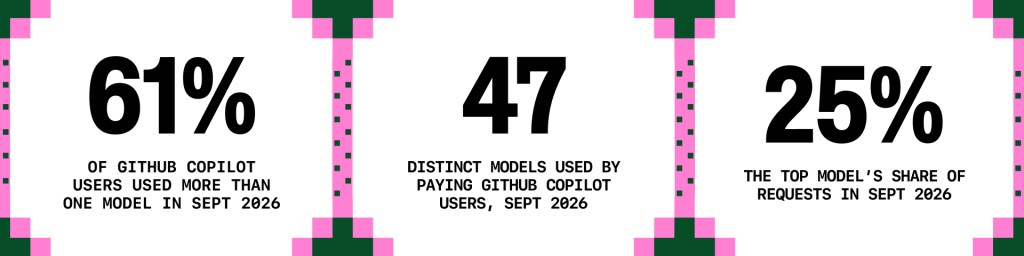 为了解开发者的选择如何分布,我们按用途对 GitHub Copilot 中使用的模型进行分组:深度推理与规划、通用、快速轻量。然后我们查看请求流向,仅统计开发者明确选择模型的活动。这排除了 GitHub Copilot 自行选择模型([自动模型选择](https://docs.github.com/copilot/concepts/models/auto-model-selection?utm_source=octoverse-auto-model-selection-docs&utm_medium=blog&utm_campaign=universe-2026))、GitHub 和 Microsoft 员工使用、后台实用模型、用于监控和测试的重复请求,以及使用开发者自己的 API 密钥发出的请求。 我们发现,在每 100 个开发者选择的请求中,38 个流向通用模型,37 个流向深度推理与规划模型,25 个流向快速轻量模型。开发者将选择分散在不同模型和功能上,约 25% 的请求流向快速模型。 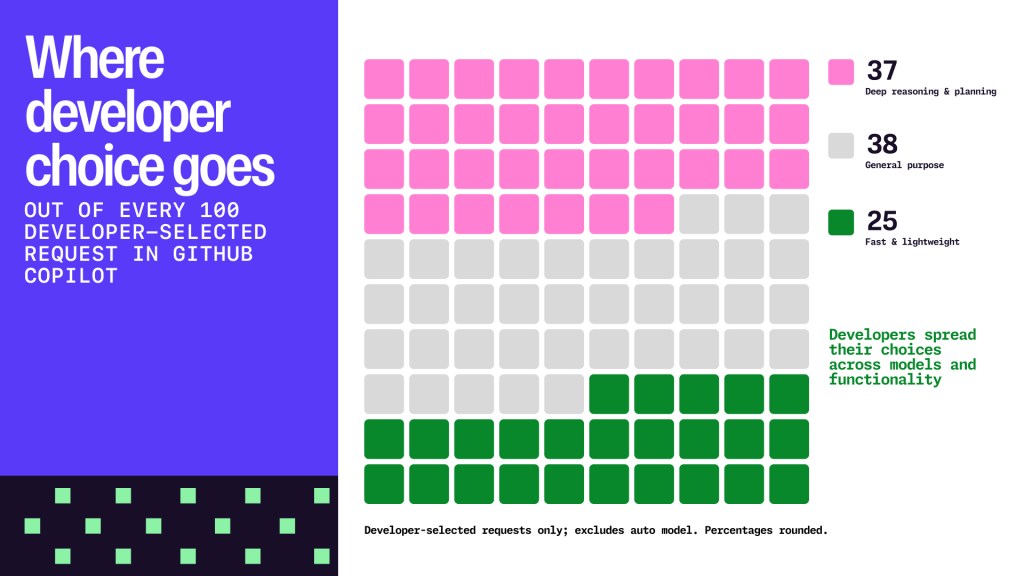 为了解这些选择如何变化,我们将其视为过去三个月的时间序列,追踪请求份额以及尝试每个模型的开发者数量和持续回访的开发者数量。有三种模式尤为突出: - **大多数开发者尚未尝试新模型之前,新模型就已被大量使用。**在发布后的最初几周,大多数新模型所承接的请求份额,超过了尝试过它们的开发者所占比例。早期采用者会在其他人跟进之前大量使用某个模型。 - **开发者在减少对某个模型的依赖后,仍会将其保留在轮换使用中。**当某个模型的请求份额下降时,仍在使用它的开发者比例下降得更慢。 - **开发者会混合使用不同类型的模型。**请求分散在全部三类模型上,很少有开发者长期只使用某一类模型。 综合来看,跨模型类型的分布表明开发者做了大量选择:模型阵容持续扩大,最佳选择随任务不同而变化,三类模型都在轮换使用。许多开发者还让 GitHub Copilot 承担其中一部分工作。2026 年 9 月,63% 的付费 GitHub Copilot 开发者至少使用过一次[自动模型选择](https://github.blog/changelog/2026-09-14-configure-cost-and-quality-in-copilot-auto-model-selection/),让 Copilot 为任务挑选模型。 规划、实现和检查一项变更,各自对模型的能力、速度和成本提出了不同要求。[Project HydraFusion](https://github.blog/ai-and-ml/github-copilot/project-hydrafusion-frontier-quality-via-multi-model-orchestration/) 最初是模型编排的研究预览,将模型与这项工作的每个步骤相匹配。在 CLI 和 GitHub Copilot 应用中,它路由了近 60,000 个会话。这项工作现已作为 [GitHub Copilot Fusion](https://docs.github.com/copilot/concepts/models/copilot-fusion?utm_source=octoverse-fusion-docs&utm_medium=blog&utm_campaign=universe-2026) 正式可用,它将模型编排与自动模型选择结合在一起,在后台为每个步骤选择正确的模型。 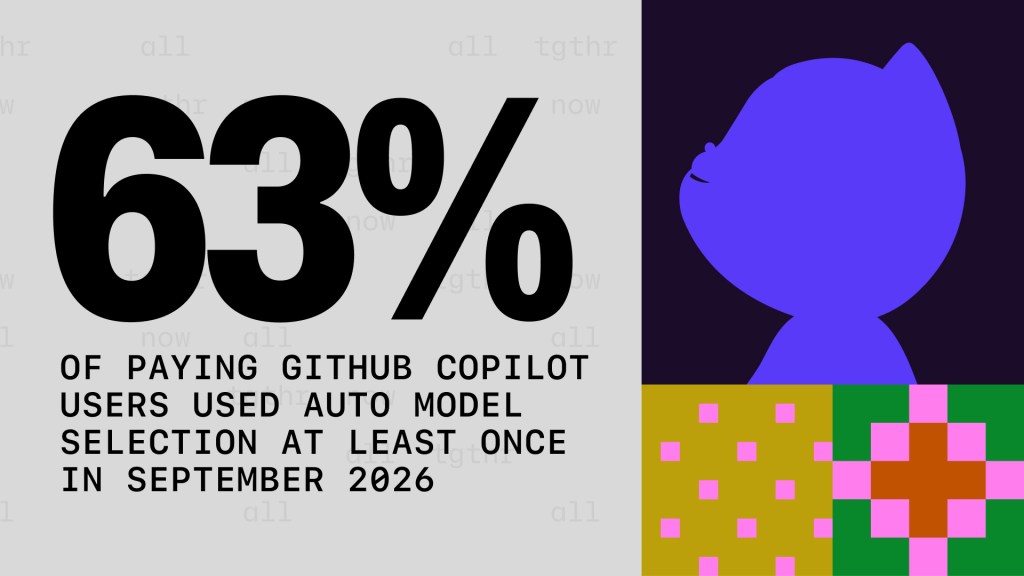 ## 语言选择有了新的影响力 语言选择长期以来反映了开发者想构建什么、团队了解什么以及现有系统需要什么。今年的数据提出了一个问题:第四种影响力是否正在出现——当开发者没有指定语言时,智能体所选择的语言。 去年,我们报告称 TypeScript 已超越 Python 和 JavaScript,成为 GitHub 上贡献者使用最多的语言。这一排序在 2026 年保持不变,TypeScript 第一,Python 第二,JavaScript 第三。增长速度加快了。从 2025 年 9 月到 2026 年 9 月,TypeScript 新增 362 万月度贡献者,Python 新增 323 万,JavaScript 新增 182 万,是前 10 种语言中增幅最大的。按百分比计算,Rust 在前列语言中增长最快,过去一年翻了一番。 我们的预测延续了近期趋势:到 2027 年 9 月,TypeScript 和 Python 的月度贡献者将各自接近 1300 万,JavaScript 为 740 万,前 10 名中的其他语言均低于约 220 万。 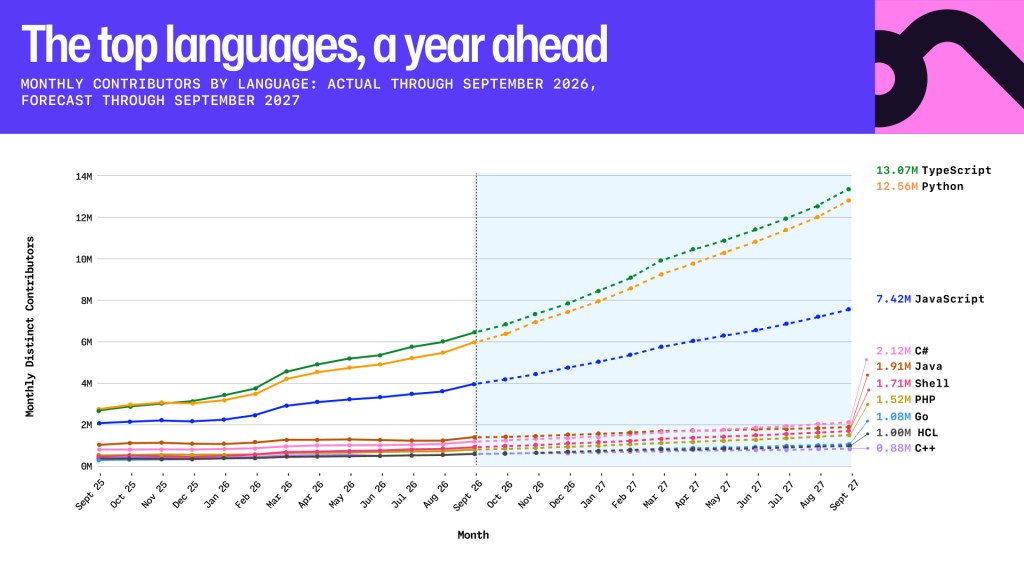 增长最快的语言也是 AI 出现最多的语言。我们将每种语言过去一年的社区增长与其合并拉取请求中检测到 AI 参与的份额进行了对照,气泡大小大致表示每种语言社区的规模。TypeScript、Python 和 Rust 是增长最快的社区,其份额也最高,约 40% 到 44% 的合并拉取请求涉及 AI。Java、C# 和 C++ 较低,约在 21% 到 34% 之间,不过在所示的所有语言中,每五个合并拉取请求中就有一个以上涉及 AI。 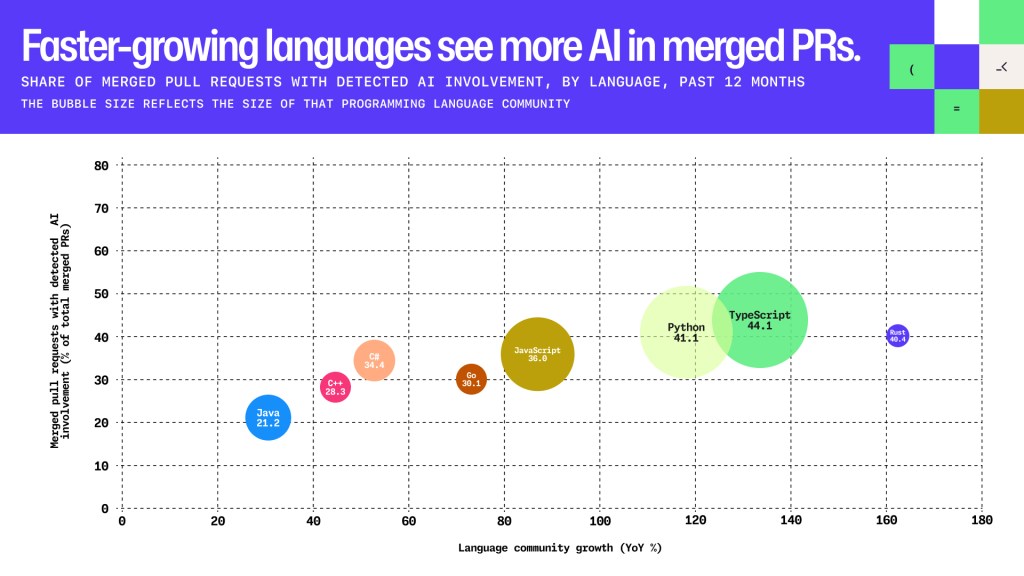 仓库数据提供了另一个视角。在 2026 年创建的仓库中,有可观察到的 agent 信号的仓库里,TypeScript 作为主要语言的比例为 35%,而没有 agent 信号的仓库中这一比例为 24%。对于 2026 年之前创建的仓库,差距类似:有 agent 信号的为 27%,没有的为 17%。这表明与 agent 打交道的开发者倾向于使用那些 agent 输出更容易检查的语言。清楚知道自己想要什么的开发者仍然会指定语言。但当他们把选择权留空时,agent 似乎会偏向更窄的一组语言,其中 TypeScript 居首。 ## 什么在吸引开发者的注意力 今年,我们将 GitHub 上增长最快、参与度最高的项目分为两组:社区与独立仓库,以及单一厂商或产品主导的仓库。社区与独立项目由基金会治理、广泛维护,或由个人领导且没有明确的商业赞助方。单一厂商和产品主导的项目是开源或源码可用的,通常也会接受大量社区贡献,但战略控制权掌握在一家公司手中。 综合来看,这两份榜单显示出一种分工。社区一侧主要是支撑其他一切的基础设施:像 vLLM、SGLang 和 llama.cpp 这样的推理引擎,像 PyTorch 这样的框架,像 Rust 和 CPython 这样的语言与运行时,以及像 Home Assistant 和 Godot 这样的平台。厂商一侧主要是开发者直接使用的工具:编码 agent、编辑器以及围绕它们的编排工具。贡献者在两个层面都有参与。增长榜单还包括一些专为欢迎新人而建的地方,比如 first-contributions 和 is-a-dev/register,许多开发者在那里提交了他们的第一个 pull request。 ##### 今年按贡献者数量增长最快的仓库 | **排名** | **社区 / 独立** | **单一厂商 / 产品主导** | | --- | --- | --- | | 1 | farion1231/cc-switch | Anthropic: anthropics/claude-code | | 2 | punkpeye/awesome-mcp-servers | OpenAI: openai/codex | | 3 | Omacom Foundation: omacom/omarchy | Anomaly: anomalyco/opencode | | 4 | firstcontributions/first-contributions | Microsoft: microsoft/vscode | | 5 | ggml-org/llama.cpp | GitHub: github/copilot-cli | | 6 | Eclipse Foundation: EclipseFdn/open-vsx.org | Zed Industries: zed-industries/zed | | 7 | sgl-project/sglang | Google: google-gemini/gemini-cli | | 8 | vllm-project/vllm | BerriAI: BerriAI/litellm | | 9 | imputnet/helium | microsoft/winget-pkgs | | 10 | vllm-project/vllm-ascend | Kilo-Org/kilocode | ##### 参与度最高的开源仓库 | **排名** | **社区 / 独立** | **单一厂商 / 产品主导** | | --- | --- | --- | | 1 | OpenClaw Foundation: openclaw/openclaw | Nous Research: NousResearch/hermes-agent | | 2 | vllm-project/vllm | Anomaly: anomalyco/opencode | | 3 | ggml-org/llama.cpp | Earendil: earendil-works/pi | | 4 | Omacom Foundation: omacom/omarchy | Stably AI: stablyai/orca | | 5 | farion1231/cc-switch | Ping: pingdotgg/t3code | | 6 | sgl-project/sglang | Microsoft: microsoft/vscode | | 7 | PyTorch Foundation: pytorch/pytorch | Graphify Labs: Graphify-Labs/graphify | | 8 | Rust Foundation: rust-lang/rust | Paperclip AI: paperclipai/paperclip | | 9 | Open Home Foundation: home-assistant/core | BerriAI: BerriAI/litellm | | 10 | Python Software Foundation: python/cpython | can1357/oh-my-pi | ## 不变的是什么 作为今年研究的一部分,我们还统计了开发者在各自代码库中最常使用的 emoji。在我们考察的每一个行业中,火箭 🚀 都以巨大优势位居榜首。它恰如其分地象征了这充满动能的一年。今年,GitHub 上的开发者涉足了更广阔的领域:比以往任何时候都更多的代码、更多的国家和更多的行业。但这一切活动都没有改变由谁来决定代码应该做什么。仍然需要有人提出想法,无论是[评估地震风险的软件](https://github.com/gem/oq-engine)、[在线服务如何更改其条款和隐私政策的公开记录](https://github.com/opentermsarchive/engine),还是[让 AI 像穴居人一样回答以节省字数的 agent 技能](https://github.com/JuliusBrussee/caveman)。也仍然需要有人来决定它是否可行、是否该被纳入,以及它是否足够好。 真正改变的是,把一个周末的灵光一现变成现实变得容易了许多。 工具会不断变化,新的行业会不断在我们意想不到的地方出现。开发者选择构建什么、为谁构建,仍然由他们自己决定。火箭 emoji 以及一切皆是如此。 * * * ## 术语表 - **Agent 配置文件:**用于设置或指导 AI 编码 agent 的代码库文件。也称为 AI 配置文件或 agentic 文件。没有该文件的代码库仍可使用 AI。 - **Agent 信号:**在遥测数据中观察到的 agent 参与迹象,例如由 agent 打开的拉取请求。这是一个下限,因为并非所有 agent 使用都能被检测到。 - **Agent 发起的拉取请求:**其初稿来自我们可检测到的编码 agent 的拉取请求。 - **自动模型选择:**GitHub Copilot 的一项设置,由 Copilot 为任务挑选模型。 - **提交:**代码库更改的已保存快照。 - **贡献:**活动事件:对提交、议题、拉取请求或讨论发表评论;创建 gist、议题、拉取请求或讨论;推送代码;以及审查拉取请求。每次推送计为一次,无论其中包含多少次提交。开源贡献是指对公开和开源代码库的贡献。 - **贡献者:**在该时间段内至少有一次贡献的 GitHub 用户。 - **Copilot 云 agent:**GitHub Copilot 的一项功能,开发者分配任务后,由 agent 独立完成。 - **Dependabot:**GitHub 的自动化工具,用于发现过时或存在漏洞的依赖项,并打开拉取请求进行更新。 - **开发者选择的请求:**由我们代理、且由开发者选择模型的模型请求。它不包括自动模型选择、员工使用、重复的监控和测试请求、后台实用模型,以及使用开发者自己的 API 密钥发出的请求。 - **GitHub Actions 作业:**GitHub Actions 工作流中的单个工作单元。 - **GitHub Advanced Security:**GitHub 的应用安全功能套件,包括代码扫描、机密扫描和依赖项审查。 - **NAICS:**北美行业分类系统,今年用于按行业对公开代码库进行分类的标准行业分类法。 - **Project HydraFusion:**GitHub 的模型编排研究预览版,它跨模型规划任务,例如一个模型起草、另一个模型审查,并在需要时由能力更强的模型介入。现已作为 GitHub Copilot Fusion 正式可用。 - **推送(Push):**将已保存的更改发送到 GitHub。一次推送可以包含多个提交。 - **堆叠式拉取请求(Stacked pull requests):**一种评审工作流,将相关工作拆分为一系列较小的拉取请求,并按顺序进行评审。 ## 方法论 - **范围与时间窗口。**Octoverse 年度统计期为 2025 年 10 月 1 日至 2026 年 9 月 30 日(含首尾)。除非另有说明,指标涵盖公开和私有仓库。行业、开源贡献和开源项目数据仅限公开仓库。往年数据:2024 年和 2025 年的数据按相同定义和时间窗口重新计算,因此可能与早期报告存在差异,早期报告仅涵盖公开活动,且时间窗口为 9 月 1 日至 8 月 31 日。 - **推送、提交与贡献。**一次推送会将一个或多个提交发送到 GitHub。贡献数对每次推送只计一次,因此提交总数可能超过贡献总数。Actions 按作业(job)计数,而非按分钟计数。开源贡献(25 亿)为公开数据。 - **过滤。**贡献者和贡献计数在可识别的情况下排除被标记为垃圾信息的账户、员工和机器人。 - **地理与预测。**开发者按自报位置映射到国家/地区,发布阈值为 100 名开发者。Octoverse 2025 发布的是 2030 年总量,而非年度目标。进展指 2025 年 9 月至 2026 年 9 月净增开发者数,占各国已发布的 2025 年数量到其 2030 年预测值之间距离的比例。 - **语言。**贡献者指每月通过推送、拉取请求、议题、评审或评论参与的去重账户,按各仓库的主要语言(Linguist)归属。一个账户可计入多种语言。此方法沿用 Octoverse 2025 的做法。预测覆盖按月均参与度排名前 10 的语言,并预测至 2027 年 9 月(显示均值)。 - **语言气泡图**比较了 2025 年 9 月至 2026 年 9 月间月度参与账户的增长,与检测到 AI 参与的已合并拉取请求占比之间的关系。气泡大小反映社区规模。 - **按对公开仓库的推送量排名的国家/地区(按个人资料位置调整)。**各国推送量按 Octoverse 年度汇总。为校正 VPN 使用带来的偏差,使用 LLM 分类从该期间有推送贡献的 GitHub 用户个人资料中提取 ISO 3166-1 alpha-2 代码,再据此构建基于个人资料位置的 ISO 3166-1 alpha-2 代码与基于 IP 地址的 ISO 3166-1 alpha-2 代码之间的比率。随后用这些比率对各国推送量进行加权。 - **行业。**2022 至 2026 年创建的公开仓库,通过微调的多语言嵌入模型,依据名称、描述、主题和 README,从每年的随机样本中归类到 NAICS 行业部门。AI 提及和由智能体开启的拉取请求(仅限可检测的智能体)被标记为单独信号。行业部门占比与 AI 提及占比可能相关,因为二者读取的是同一文本。占比为估算值。 - **开源排名。**仓库按谁掌握战略控制权分为社区型或单一供应商型。“增长最快”按去重贡献账户的同比绝对增量排名。“参与度最高”综合仓库在星标、复刻以及去重拉取请求和议题创建者方面的排名。复刻的仓库不列入这两个榜单。 - **模型选择。**数据涵盖 GitHub Copilot,且仅统计开发者主动选择的请求。不包含自动模型选择、员工使用、重复的监控请求、后台实用模型,以及使用开发者自有 API 密钥发起的请求。每个模型需至少有 1,000 名周活跃用户才计入统计。模型按其用途分组,示例按提供商字母顺序列出: - **深度推理与规划:**Claude Opus 5.5、GPT 5.5。 - **通用:**Claude Sonnet 5、Grok 4.7、GPT 6.1 Sol。 - **快速轻量:**Claude Haiku 5.5、Gemini 3.8 Flash、GPT 6 Luna。 - 数据描述的是实际观测到的使用情况,而非模型质量。趋势观察使用 2026 年 7 月 14 日至 10 月 13 日的周度数据。 - **请求份额**指截至 2026 年 10 月 13 日的 7 天周期内,各模型组占所有符合条件请求的比例。 - **互操作性。**统计每年创建的公开仓库,其名称、描述、主题或 README 中提及互操作性或逆向工程,或相关术语,例如净室实现、直接替换或协议重新实现。 - **预测。**我们对历史 GitHub 数据、注册量、产品使用情况和市场规模运行了 43 个时间序列和回归模型,预测 GitHub 上的开发者数量到 2031 年 9 月相对于 2026 年 9 月的变化。结果分为 3 倍或以上(21 个模型)、2 倍至不足 3 倍(19 个)以及不足 2 倍(3 个)。Octoverse 2025 使用了五个模型。没有预测是完全准确的。 文章 [Octoverse:2026 年开发者借助智能体构建,提交、推送与覆盖范围均创新高](https://github.blog/news-insights/octoverse/octoverse-commits-pushes-reach-new-highs-in-2026-as-developers-build-with-agents/) 首次发布于 [The GitHub Blog](https://github.blog/)。 ## 正文 · 原文 Developers pushed code to GitHub 17.9 billion times in the past 12 months, more than in 2024 and 2025 combined. Behind that number are developers building what interests them and what their communities need. In Nepal, one developer [built a flood bulletin on GitHub Pages](https://github.com/nirajbhusal/rasuwa-flood-bulletin) with verified information on roads, rescue, weather, and power. It has since grown into [Gati](https://github.com/nirajbhusal/gati-alerts), a Nepali-first relay of official disaster alerts that runs on GitHub Pages and Actions. Elsewhere, developers at NASA’s Jet Propulsion Laboratory are creating [software designed to run programs aboard spacecraft](https://github.com/nasa/spacewasm), and fans [built open-source firmware that lets people customize their e-readers](https://github.com/crosspoint-reader/crosspoint-reader). Curiosity, aimed in every direction, at a scale GitHub hasn’t seen before. That growth happened quickly. Partway through the year, activity on GitHub bent sharply upward, just as agents went from something developers were trying out to something they were working alongside. Developers picked from more models than ever and built in industries we are highlighting in this report for the first time, from health care to agriculture. Octoverse is our chance to step back and look at the whole picture. This year, that picture is bigger than ever. Here is what stood out most: - **More AI, more of everything.** Among repositories created this year, the average repo with an agent configuration file logged eight times as many commits as the average new repo without one. - **As of September, developers start more than 40% of pull requests with an agent.** In March, it was 17%. For a growing share of work, the first move is now directing an agent, and review is how developers shape what comes back. - **Developers move fast on model choice.** In September, 61% of GitHub Copilot users used more than one model, and requests spread across general purpose, deep reasoning and planning, and fast and lightweight models - **Builders are showing up from every field.** This year, for the first time, we’re sharing our view of public repositories by industry. Repos serving mining, construction, health care, and agriculture have each grown several times over since 2022. Underneath it all, AI models and the harnesses built around them have advanced over the past year, and developers have more to choose from. Growth is moving quickly: one year into last year’s five-year developer growth projections, every country we projected has already closed at least a fifth of its distance to 2030, and our own forecasting models no longer agree on where it will go next. ## The year developers set a new pace  This year was all about momentum. Developers pushed code changes to GitHub 17.9 billion times in the past 12 months, more than 2024 and 2025 combined. Commits across all repo types (public and private) climbed even faster to 34.3 billion, more than three times where they stood two years ago. Merged pull requests more than tripled to 1.3 billion over the same period, an average of 3.5 million a day. Agents were one of the tools developers leaned on hardest this year, pulling them deeper into daily work. Among repos created this year, the average repo with an agent configuration file logged eight times as many commits as the average new repo without one, sign that individuals and teams building with agents from day one are moving at a markedly different pace. Developers also relied on automations to keep projects moving. GitHub Actions ran a job 1,440 times every second this year. This equals 124 million times a day and is more than three times last year’s total. Developers merged more than 30 million Dependabot pull requests to keep dependencies current and reduce the use of known vulnerabilities, about double 2025’s pace.  Our telemetry shows activity climbing steadily from January, then surging around June, as if developers everywhere saw new possibilities at once. Right around then, a cluster of industry-wide shifts landed: better underlying models, the harnesses and tools built around them, and the agents running on both. Agents moved from single-session tools to persistent ones that could track progress across days and orchestrate other specialized agents. Just as important, agents began making extensive use of the cloud, executing work remotely as well as on local machines.  This momentum is showing up both in brand-new repos and from developers who have been building for years. From June onwards, about 55% of all commits came from brand new repositories. But plenty more commits came from developers who’ve been around a while: developers who pushed code in the past 12 months have been on GitHub for an average of 36 months, and of those who opened a pull request in August, more than 75% pushed code in September. They are also branching out: the average developer now works across 10% more repositories than they did a year ago. That staying power shows up in open source too. Public contributions soared to 2.5 billion in 2026, more than double last year’s total (1.12 billion). Behind those numbers are developers who keep showing up, like [@kinlane,](https://github.com/kinlane) who made more than 1 million contributions across his public repositories using agentic workflows to keep a machine-readable catalog of public API information current. Another example is [@kim-em](https://github.com/kim-em), who made more than 178,000 contributions while maintaining mathlib, which is a community library of computer-checked mathematics. [@andig](https://github.com/andig), a maintainer of the open source EV charging controller and home energy management system [evcc](https://github.com/evcc-io/evcc), contributed over 21,000 times. These are just a few examples of the work millions of developers do every day. To all the developers doing work like this and beyond: we see you, and we’re glad you’re building. ## Developers are building from more places Behind every number in this report is a developer. GitHub now serves more than 225 million of them, and the community is growing around the globe. The United States (38.3 million) and India (32 million) remain the two largest developer communities, and each added more than 10 million developers this year. Brazil added 3.28 million developers on GitHub this year, the third most of any country. | **Country** | **Total number of developers on GitHub in Sept. 2026** | | --- | --- | | United States | 38.3 M | | India | 32.0 M | | China | 12.4 M | | Brazil | 10.2 M | | Japan | 7.15 M | | United Kingdom | 6.47 M | | Indonesia | 6.34 M | | Germany | 6.30 M | | Russia | 5.07 M | | France | 4.75 M | Last year, we projected that India would reach 57.5 million developers by 2030 and the United States 54.7 million. One year into that five-year window, every country in our projections has already closed at least a fifth of the distance to its own 2030 figure. The United States has closed 38.6%, and India 28.3%.  The same momentum shows up across regions, each with its own local context: | **Region** | **Growth driver** | **Market context** | | --- | --- | --- | | Americas | Fintech and digital payments | • **Brazil**: mature, fast-growing fintech sector
• **Canada**: steady AI and software investment | | EMEA | AI adoption in manufacturing and startups. Fast-growing developer community in Africa | • **Morocco**: fintech and startup scene
• **Germany**: enterprise AI adoption across its industrial heartland
• **France and Spain**: AI and deep-tech startups
• **Kenya, Nigeria, South Africa**: fintech, agritech, and coding bootcamps | | APAC | Government investment in AI infrastructure and talent | • **Indonesia**: booming digital economy
• **Japan**: AI infrastructure investment
• **South Korea**: government-backed AI talent programs
• **Australia**: AI, machine learning, and data skills | One year in, growth is strong against last year’s projection, and projecting the next five years is getting harder. We ran more than 40 forecasting models forward to 2031, time-series and regression models built on historical sign-up and usage data, each assuming a different pace of growth. About half call for “extreme” growth, with developer counts on GitHub more than tripling by 2031. Just under half call for “substantial” growth, doubling to tripling. Only three models expect anything close to modest, under 2x growth.  Forecasts are estimates, and a spread this wide shows how much the 2026 surge widened what is plausible by 2031. What holds steady is the shape of the trend: a developer community growing in more places at once. ## The future is being built everywhere In past reports, “everywhere” meant more developers and more countries, such as in the context of the top countries contributing code to public repositories: ##### Top 10 countries by pushes to public repositories, adjusted by profile location | **Rank** | **Country** | | --- | --- | | 1 | United States | | 2 | India | | 3 | China | | 4 | Brazil | | 5 | Germany | | 6 | United Kingdom | | 7 | Korea | | 8 | France | | 9 | Japan | | 10 | Canada | This year, it also means more fields, including industries we haven’t measured before. We’re sharing our view of public repositories by industry using the North American Industry Classification System (NAICS), which sorts economic activity into sectors. A language model classified random samples of public repositories created each year from 2022 to 2026, assigning each to the industry it serves based on its name, description, topics, and README. We also tracked two signals: whether a repository mentions AI, and whether an agent opened a pull request against it. The two signals do not always move together. In administrative and support services, mining, health care, and agriculture, more than four in 10 repositories mention AI, yet agent-opened pull requests are rare, less than 3 percent. Construction breaks that pattern. About a quarter of its repositories mention AI, but about 9 percent have agent-opened pull requests, the highest share of any sector, with manufacturing next.  The same classification shows how each industry’s footprint has shifted since 2022, and sectors well beyond software are climbing. Professional, scientific, and technical services rose from fourth to second place among all industries, behind only information. Agriculture, forestry, fishing and hunting climbed two spots, and finance and insurance and health care and social assistance each moved up one. Against each sector’s own 2022 baseline, mining, quarrying, and oil and gas extraction grew roughly 65 times from a small starting base, administrative and support services and construction 17 to 18 times, and even manufacturing, the slowest of these, almost tripled.  Behind these sector shifts are people who know their fields, now using AI coding agents to build. For example, in manufacturing, a small team built a way to [turn a photo of your tools into a custom-fit, 3D-printable drawer organizer](https://github.com/tracefinity/tracefinity). A research lab in health care made it easier for scientists to [analyze huge digital scans of tissue samples](https://github.com/rendeirolab/wsidata), the kind pathologists study to understand disease. In Copenhagen, a university lab built a [pipeline that classifies video of chickens at play, from frolicking to worm chasing](https://github.com/sbhattlab/PlayClass). A University of Waikato energy center built a [toolkit that helps industrial plants find heat they can reuse](https://github.com/waikato-ahuora-smart-energy-systems/OpenPinch), and Bulgaria’s digital ministry open-sourced a [portal where anyone can trace who won a public contract and for how much](https://github.com/midt-bg/sigma). For writers, a novelist built a [free app that makes a manuscript look like a book as you type](https://github.com/hughhowey/neo). In field after field, the people closest to the problem are building the solution, with agents helping along the way. Professional, scientific, and technical services, which grew about 5 times over its own 2022 baseline and climbed to second place, is the work of researching, engineering, and advising, and open code has long been part of how that work gets done. In biochemistry, the work behind [AlphaFold](https://github.com/google-deepmind/alphafold) earned Demis Hassabis and John Jumper a share of the 2024 Nobel Prize in Chemistry. In computer science, [Tensor2Tensor](https://github.com/tensorflow/tensor2tensor) accompanied the paper that introduced the Transformer, the architecture behind today’s large language models, [“Attention Is All You Need.”](https://arxiv.org/abs/1706.03762) In medicine, [sars-cov-2-stability](https://github.com/dylanhmorris/sars-cov-2-stability) held the code and data behind one of the earliest papers on how long the virus survives in the air and on surfaces. In physics, [eht-imaging](https://github.com/achael/eht-imaging) was one of two open-source libraries used to reconstruct the [first image of a black hole](https://arxiv.org/abs/1906.11241). A repository has quietly become part of the paper trail behind published research. ## Developers are reshaping their workflow More developers now begin a pull request by specifying what they want and orchestrating the agents that carry it out. By September 2026, more than 40% of pull requests on GitHub started with an agent’s first draft, up from 17% in March. That is 110 million in September alone, about 6x March’s volume.  Agent-started pull requests also more often change multiple files: about 87%, compared with 79% of pull requests without detected agent involvement. They are landing quickly too. In February, 83% of agent-involved pull requests merged within two weeks, a touch behind the roughly 86% for pull requests without detected agent involvement. By September, agent pull requests were at 90%, while the comparison group held at about 86%.  Among GitHub Copilot’s monthly active users, 55% now use agentic features, up from 35% a year ago. The steepest growth is in the most hands-off mode. Copilot cloud agent, where a developer assigns a task and an agent works on it independently, grew 230% year over year, against 85% for agent chat. Developers still ask agents questions, and increasingly they hand over whole tasks. The willingness to delegate is reflected by the kinds of tasks developers are attempting. Public repositories mentioning interoperability or reverse engineering increased more than 300% year over year, from about 30,000 created in 2025 to more than 130,000 in 2026.  Review is where developers shape what comes back, and more tooling is being built for it. [Stacked pull requests](https://docs.github.com/pull-requests/how-tos/stacked-pull-requests?utm_source=octoverse-pr-stacks-docs&utm_medium=blog&utm_campaign=universe-2026), which split related work into smaller changes that are easier to review in sequence, launched as a preview on July 30, and more than 264,000 developers had used them by September. Usage of AI-assisted code review and GitHub Advanced Security both grew more than 90% year over year. The platform also helps secure that work: push protection, which screens for exposed secrets such as API keys and passwords, ran 5.8 billion scans this year, nearly four times 2025’s pace. Developers are investing in how they review code. ## Model choice moves at developer speed Developers match models to the work they hand to their agents. In September 2026, 61% of GitHub Copilot users who selected a model themselves used more than one model across their sessions, up from 50% four months earlier. The lineup is growing too: developers on paid GitHub Copilot plans used 29 distinct models in May and 47 in September, and no single model carried more than 25% of requests that month. Some model decisions come down to cost and familiarity. Developers weigh price and functionality against need and may lean toward providers they already trust.  To see how developer choices spread, we grouped the models used in GitHub Copilot by what they are built for: deep reasoning and planning, general purpose, and fast and lightweight. We then looked at where requests went, counting only activity where a developer explicitly selected a model. That leaves out cases where GitHub Copilot picks the model ([auto model selection](https://docs.github.com/copilot/concepts/models/auto-model-selection?utm_source=octoverse-auto-model-selection-docs&utm_medium=blog&utm_campaign=universe-2026)), GitHub and Microsoft staff usage, background utility models, duplicate requests used for monitoring and testing, and requests made with a developer’s own API key. We found that out of every 100 developer-selected requests, 38 went to general purpose models, 37 to deep reasoning and planning models, and 25 to fast and lightweight models. Developers spread their choices across models and functionality, and about 25% of requests go to a fast model.  To see how those choices shift, we looked at them as a time series over the past three months, tracking request share alongside how many developers tried each model and how many kept coming back. Three patterns stand out: - **New releases are used heavily before most developers have tried them.** In their first weeks, most new models take a larger share of requests than the portion of developers who have tried them. Early adopters use a model heavily before the rest follow. - **Developers keep a model in rotation after leaning on it less.** When a model’s share of requests falls, the share of developers still using it falls more slowly - **Developers blend kinds of models.** Requests spread across all three groups, and few developers stay with any one kind for long. Taken together, the spread across kinds of models points to a lot of choosing: a lineup that keeps growing, a best fit that shifts from one task to the next, and all three kinds of models held in rotation. Many developers also let GitHub Copilot do some of it. In September 2026, 63% of paying GitHub Copilot developers used [auto model selection](https://github.blog/changelog/2026-09-14-configure-cost-and-quality-in-copilot-auto-model-selection/) at least once, letting Copilot pick the model for the task. Planning, implementing, and checking a change each place different demands on a model, in capability, speed, and cost. [Project HydraFusion](https://github.blog/ai-and-ml/github-copilot/project-hydrafusion-frontier-quality-via-multi-model-orchestration/), began as a research preview of model orchestration, matching models to each step of that work. In the CLI and the GitHub Copilot app, it routed almost 60,000 sessions. That work is now generally available as [GitHub Copilot Fusion](https://docs.github.com/copilot/concepts/models/copilot-fusion?utm_source=octoverse-fusion-docs&utm_medium=blog&utm_campaign=universe-2026), which brings model orchestration together with auto model selection and chooses the right model for each step behind the scenes.  ## Language choice has new influence Language choice has long reflected what developers want to build, what their teams know, and what existing systems require. This year’s data raises the question of whether a fourth influence is emerging: the language an agent picks when a developer doesn’t specify one. Last year, we reported that TypeScript had overtaken Python and JavaScript to become the most used language on GitHub by contributors. That order held in 2026, with TypeScript first, Python second, and JavaScript third. The pace picked up. From September 2025 to September 2026, TypeScript added 3.62 million monthly contributors, Python 3.23 million, and JavaScript 1.82 million, the largest gains among the top 10 languages. Rust grew fastest by percentage among the top languages, doubling in the past year. Our forecasts extend recent trends: TypeScript and Python near 13 million monthly contributors each by September 2027, JavaScript at 7.4 million, and every other language in the top 10 below about 2.2 million.  The languages growing fastest are also where AI shows up most. We charted each language’s community growth over the past year against the share of its merged pull requests with detected AI involvement, with bubbles roughly sized to show the size of each language’s community. TypeScript, Python, and Rust, the fastest-growing communities, have the highest shares, about 40% to 44% of merged pull requests. Java, C#, and C++ sit lower, between about 21% and 34%, though AI shows up in more than one in five merged pull requests in every language shown.  The repository data adds another angle. Among repositories created in 2026, TypeScript was the primary language in 35% of those with an observed agent signal, compared to 24% without one. For repositories created before 2026, the gap was similar: 27% with an agent signal, versus 17% without. That suggests developers who work with agents gravitate toward languages where agent output is easier to check. Developers who know exactly what they want still specify the language. But when they leave the choice open, agents appear to favor a narrower set of languages, TypeScript chief among them. ## What is capturing developer attention This year, we split the fastest-growing and most-engaged projects on GitHub into two groups: community and independent repositories, and single-vendor or product-led ones. Community and independent projects are foundation-governed, broadly maintained, or led by an individual without a clear commercial sponsor. Single-vendor and product-led projects are open source or source-available and often take substantial community contributions, but strategic control sits with one company. Read together, the two lists show a division of labor. The community side is mostly the foundation underneath everything else: inference engines like vLLM, SGLang, and llama.cpp, frameworks like PyTorch, languages and runtimes like Rust and CPython, and platforms like Home Assistant and Godot. The vendor side is mostly the tools developers work with directly: coding agents, editors, and the orchestration around them. Contributors are showing up for both layers. The growth list also includes places built to welcome newcomers, like first-contributions and is-a-dev/register, where many developers make their first pull request. ##### This year’s fastest-growing repositories by contributors | **Rank** | **Community / independent** | **Single vendor / product-led** | | --- | --- | --- | | 1 | farion1231/cc-switch | Anthropic: anthropics/claude-code | | 2 | punkpeye/awesome-mcp-servers | OpenAI: openai/codex | | 3 | Omacom Foundation: omacom/omarchy | Anomaly: anomalyco/opencode | | 4 | firstcontributions/first-contributions | Microsoft: microsoft/vscode | | 5 | ggml-org/llama.cpp | GitHub: github/copilot-cli | | 6 | Eclipse Foundation: EclipseFdn/open-vsx.org | Zed Industries: zed-industries/zed | | 7 | sgl-project/sglang | Google: google-gemini/gemini-cli | | 8 | vllm-project/vllm | BerriAI: BerriAI/litellm | | 9 | imputnet/helium | microsoft/winget-pkgs | | 10 | vllm-project/vllm-ascend | Kilo-Org/kilocode | ##### The most-engaged open-source repositories | **Rank** | **Community / independent** | **Single vendor / product-led** | | --- | --- | --- | | 1 | OpenClaw Foundation: openclaw/openclaw | Nous Research: NousResearch/hermes-agent | | 2 | vllm-project/vllm | Anomaly: anomalyco/opencode | | 3 | ggml-org/llama.cpp | Earendil: earendil-works/pi | | 4 | Omacom Foundation: omacom/omarchy | Stably AI: stablyai/orca | | 5 | farion1231/cc-switch | Ping: pingdotgg/t3code | | 6 | sgl-project/sglang | Microsoft: microsoft/vscode | | 7 | PyTorch Foundation: pytorch/pytorch | Graphify Labs: Graphify-Labs/graphify | | 8 | Rust Foundation: rust-lang/rust | Paperclip AI: paperclipai/paperclip | | 9 | Open Home Foundation: home-assistant/core | BerriAI: BerriAI/litellm | | 10 | Python Software Foundation: python/cpython | can1357/oh-my-pi | ## What doesn’t change As part of our research this year, we also tracked the emoji developers used most in their repositories. Across every industry we looked at, the rocket 🚀 topped the list, by a wide margin. A fitting symbol for a year of momentum. Developers on GitHub covered more ground this year: more code, more countries, and more industries than we’ve ever measured. None of that activity changes who decides what the code should do. Someone still has to come up with the idea, whether it’s [software that assesses earthquake risk](https://github.com/gem/oq-engine), [an open record of how online services change their terms and privacy policies](https://github.com/opentermsarchive/engine), or [an agent skill that makes an AI answer like a caveman to save on words](https://github.com/JuliusBrussee/caveman). And someone still has to decide whether it works, whether it belongs, and whether it’s good. What did change is how much easier it is to take an idea from a weekend thought to something real. The tools will keep changing, and new industries will keep showing up in places we didn’t expect. What a developer chooses to build, and who they build it for, is still theirs to decide. Rocket emoji and all. * * * ## Glossary - **Agent configuration file:** A repository file that sets up or directs an AI coding agent. Also called an AI configuration file or agentic file. Repositories without one may still use AI. - **Agent signal:** An observed sign of agent involvement in telemetry, such as an agent-opened pull request. It is a floor, since not all agent use may be detected. - **Agent-started pull request:** A pull request whose first draft came from a coding agent that we can detect. - **Auto model selection:** A GitHub Copilot setting where Copilot picks the model for the task. - **Commit:** A saved snapshot of changes to a repository. - **Contributions:** Activity events: commenting on a commit, issue, pull request, or discussion; creating a gist, issue, pull request, or discussion; pushing code; and reviewing a pull request. Each push counts once, however many commits it holds. Open-source contributions are contributions to public and open source repositories. - **Contributors:** GitHub users with at least one contribution in the period. - **Copilot cloud agent:** A GitHub Copilot feature where a developer assigns a task and an agent works on it independently. - **Dependabot:** GitHub’s automated tool that finds outdated or vulnerable dependencies and opens pull requests to update them. - **Developer-selected request:** A model request where we proxied the developer chose the model. It excludes auto model selection, staff usage, duplicate monitoring and testing requests, background utility models, and requests made with a developer’s own API key. - **GitHub Actions job:** A single unit of work in a GitHub Actions workflow. - **GitHub Advanced Security:** GitHub’s suite of application security features, including code scanning, secret scanning, and dependency review. - **NAICS:** The North American Industry Classification System, the standard sector taxonomy used this year to classify public repositories by industry. - **Project HydraFusion:** A GitHub research preview of model orchestration, which plans a task across models, such as one drafting, another reviewing, and a more capable one stepping in when needed. Now generally available as GitHub Copilot Fusion. - **Push:** Sending saved changes to GitHub. One push can carry many commits. - **Stacked pull requests:** A review workflow that splits related work into a sequence of smaller pull requests that are reviewed in order. ## Methodology - **Scope and window.** The Octoverse year runs October 1, 2025 to September 30, 2026, inclusive. Unless noted, metrics include public and private repositories. Industry, open-source contribution, and open-source project figures are public only. Prior years: 2024 and 2025 figures are recalculated on the same definitions and window, so they may differ from earlier reports, which covered public activity and a September 1 to August 31 window. - **Pushes, commits, and contributions.** A push sends one or more commits to GitHub. Contributions count each push once, so commit totals can exceed contribution totals. Actions are counted in jobs, not minutes. Open-source contributions (2.5 billion) are public. - **Filtering.** Contributor and contribution counts exclude spam-flagged accounts, staff, and bots where identifiable. - **Geography and projections.** Developers are mapped to countries by self-reported location, with a 100-developer publication threshold. Octoverse 2025 published 2030 totals, not annual targets. Progress is net developers added from September 2025 to September 2026 as a share of the distance from each country’s published 2025 count to its 2030 projection. - **Languages.** Contributors are distinct accounts each month that took part through pushes, pull requests, issues, reviews, or comments, attributed to each repository’s primary language (Linguist). An account can count in several languages. This follows the Octoverse 2025 method. Forecasts cover the top 10 languages by average monthly participation and project to September 2027 (mean shown). - The **language bubble chart** compares growth in monthly participating accounts between September 2025 and September 2026 with the share of merged pull requests with detected AI involvement. Bubble size reflects community size. - **Top countries by pushes to public repositories, adjusted by profile location.** Pushes from each country were summed across the Octoverse year. To adjust for biases caused by VPN usage, LLM classification was used to extract the ISO 3166-1 alpha-2 code from the profiles of GitHub users who contributed pushes during this period, which were then used to construct ratios of ISO 3166-1 alpha-2 codes based on profile location vs. ISO 3166-1 alpha-2 codes based on IP address. These ratios were then used to weight the pushes from each country. - **Industry.** Public repositories created 2022 to 2026 were sorted into NAICS sectors by a fine-tuned multilingual embedding model using name, description, topics, and README, from random samples per year. AI mentions and agent-opened pull requests (detectable agents only) were flagged as separate signals. Sector and AI-mention shares can be related because both read the same text. Shares are estimates. - **Open-source rankings.** Repositories are classed as community or single-vendor by who holds strategic control. “Fastest-growing” ranks by the absolute year-over-year increase in distinct contributing accounts. “Most engaged” blends a repository’s rankings for stars, forks, and distinct pull request and issue creators. Forked repositories are excluded from both lists. - **Model choice.** Figures cover GitHub Copilot and count developer-selected requests only. They exclude auto model selection, staff usage, duplicate monitoring requests, background utility models, and requests made with a developer’s own API key. Each model needs at least 1,000 weekly active users to count. Models are grouped by what they are built for, with examples listed alphabetically by provider: - **Deep reasoning and planning:** Claude Opus 5.5, GPT 5.5. - **General purpose:** Claude Sonnet 5, Grok 4.7, GPT 6.1 Sol. - **Fast and lightweight:** Claude Haiku 5.5, Gemini 3.8 Flash, GPT 6 Luna. - Figures describe observed use, not model quality. Trend observations use weekly data from July 14 to October 13, 2026. - **Request share** is the share of all qualifying requests per model group in a 7-day period ending October 13, 2026. - **Interoperability.** Counts public repositories created each year whose name, description, topics, or README mention interoperability or reverse engineering, or related terms, such as clean room implementation, drop-in replacement, or protocol re-implementation. - **Forecasts.** We ran 43 time-series and regression models on historical GitHub data, sign-ups, product usage, and market sizing, projecting developers on GitHub to September 2031 relative to September 2026. Outcomes group as 3x or more (21 models), 2x to under 3x (19), and under 2x (3). Octoverse 2025 used five models. No forecast is perfectly accurate. The post [Octoverse: Commits, pushes, reach new highs in 2026 as developers build with agents](https://github.blog/news-insights/octoverse/octoverse-commits-pushes-reach-new-highs-in-2026-as-developers-build-with-agents/) appeared first on [The GitHub Blog](https://github.blog/).
• **加拿大**:稳定的人工智能与软件投资 | | 欧洲、中东和非洲 | 制造业与初创企业中的AI应用。非洲快速增长的开发者社区 | • **摩洛哥**:金融科技与初创企业生态
• **德国**:其工业核心地带的企业级AI应用
• **法国和西班牙**:AI与深科技初创企业
• **肯尼亚、尼日利亚、南非**:金融科技、农业科技与编程训练营 | | 亚太 | 政府对AI基础设施和人才的投资 | • **印度尼西亚**:蓬勃发展的数字经济
• **日本**:AI基础设施投资
• **韩国**:政府支持的AI人才项目
• **澳大利亚**:AI、机器学习与数据技能 | 一年过去,增长相对于去年的预测表现强劲,而预测未来五年正变得越来越难。我们将40多个预测模型推演至2031年,这些基于历史注册和使用数据构建的时间序列与回归模型各自假设了不同的增长速度。约一半模型预测“极端”增长,即到2031年GitHub上的开发者数量将增长两倍以上。略低于一半的模型预测“大幅”增长,即增长一到两倍。只有三个模型预期接近温和增长,即低于2倍。  预测只是估计,如此大的分布差异表明2026年的激增在多大程度上拓宽了到2031年的可能区间。保持不变的是趋势的形态:开发者社区正在更多地方同时增长。 ## 未来正在各地构建 在过去的报告中,“各地”意味着更多开发者和更多国家,例如在向公共仓库贡献代码的头部国家这一语境下: ##### 按个人资料所在地调整后,向公共仓库推送次数排名前10的国家 | **排名** | **国家** | | --- | --- | | 1 | 美国 | | 2 | 印度 | | 3 | 中国 | | 4 | 巴西 | | 5 | 德国 | | 6 | 英国 | | 7 | 韩国 | | 8 | 法国 | | 9 | 日本 | | 10 | 加拿大 | 今年,它还意味着更多领域,包括我们此前未曾测量的行业。 我们使用北美行业分类系统(NAICS)来分享我们对各行业公共仓库的看法,该系统将经济活动划分为多个部门。一个语言模型对2022年至2026年每年创建的公共仓库随机样本进行分类,根据其名称、描述、主题和README将每个仓库归入其所服务的行业。我们还追踪了两个信号:仓库是否提及AI,以及是否有智能体对其发起过拉取请求。 这两个信号并不总是同步变化。在行政与支持服务、采矿、医疗保健和农业领域,超过四成的代码仓库提及 AI,但由智能体发起的拉取请求却很少,不到 3%。建筑业打破了这一模式。其约四分之一的仓库提及 AI,但约 9% 拥有由智能体发起的拉取请求,是所有行业中占比最高的,制造业紧随其后。  同一分类还显示了自 2022 年以来各行业的足迹如何变化,而且远不止软件行业的领域正在攀升。专业、科学和技术服务业在所有行业中从第四位升至第二位,仅次于信息业。农业、林业、渔业和狩猎业上升两位,金融与保险业以及医疗保健和社会援助业各上升一位。以各行业自身 2022 年的基线衡量,采矿、采石以及石油和天然气开采业从较小的起点增长了约 65 倍,行政与支持服务业和建筑业增长了 17 至 18 倍,即便是其中增长最慢的制造业也几乎增长了两倍。  这些行业变化的背后,是了解自身领域的人们如今正使用 AI 编程智能体来构建。例如,在制造业,一个小团队构建了一种方法,[将你的工具照片转化为定制贴合、可 3D 打印的抽屉收纳盒](https://github.com/tracefinity/tracefinity)。医疗保健领域的一个研究实验室让科学家更容易[分析组织样本的大型数字扫描图像](https://github.com/rendeirolab/wsidata),也就是病理学家研究疾病时所查看的那类图像。在哥本哈根,一个大学实验室构建了一条[流水线,用于对鸡玩耍的视频进行分类,从嬉戏到追逐虫子](https://github.com/sbhattlab/PlayClass)。怀卡托大学的一个能源中心构建了一套[工具包,帮助工业工厂找到可再利用的热量](https://github.com/waikato-ahuora-smart-energy-systems/OpenPinch),保加利亚数字部开源了一个[门户网站,任何人都可以追踪谁赢得了公共合同以及金额多少](https://github.com/midt-bg/sigma)。对于写作者,一位小说家构建了一款[免费应用,让你在打字时手稿看起来就像一本书](https://github.com/hughhowey/neo)。在一个又一个领域,最接近问题的人正在构建解决方案,智能体一路提供帮助。 专业、科学和技术服务业较其自身 2022 年基线增长了约 5 倍,并攀升至第二位,其工作是研究、工程和咨询,而开放代码长期以来一直是这类工作完成方式的一部分。在生物化学领域,[AlphaFold](https://github.com/google-deepmind/alphafold) 背后的工作为 Demis Hassabis 和 John Jumper 赢得了 2024 年诺贝尔化学奖的一部分。在计算机科学领域,[Tensor2Tensor](https://github.com/tensorflow/tensor2tensor) 伴随了引入 Transformer 的论文,这一架构正是当今大语言模型的基础,即[《Attention Is All You Need》](https://arxiv.org/abs/1706.03762)。在医学领域,[sars-cov-2-stability](https://github.com/dylanhmorris/sars-cov-2-stability) 保存了关于病毒在空气和表面存活多久的最早论文之一的代码和数据。在物理学领域,[eht-imaging](https://github.com/achael/eht-imaging) 是用于重建[首张黑洞图像](https://arxiv.org/abs/1906.11241)的两个开源库之一。一个代码仓库已悄然成为已发表研究背后论文记录的一部分。 ## 开发者正在重塑他们的工作流程 如今更多开发者开始一个拉取请求时,会先说明他们想要什么,并编排执行该任务的智能体。到 2026 年 9 月,GitHub 上超过 40% 的拉取请求以智能体的初稿开始,高于 3 月的 17%。仅 9 月就有 1.1 亿个,约为 3 月数量的 6 倍。  由 Agent 发起的拉取请求也更常改动多个文件:约 87%,而未检测到 Agent 参与的拉取请求为 79%。它们的合并速度也很快。2 月,83% 的 Agent 参与拉取请求在两周内合并,略低于未检测到 Agent 参与的拉取请求约 86% 的比例。到 9 月,Agent 拉取请求达到 90%,而对照组保持在约 86%。  在 GitHub Copilot 的月活跃用户中,55% 现在使用 Agent 功能,高于一年前的 35%。增长最陡峭的是最省心的模式。Copilot cloud agent 由开发者分配任务、Agent 独立完成,同比增长 230%,而 Agent 聊天为 85%。开发者仍会向 Agent 提问,并且越来越多地把整个任务交给它。 这种委托意愿体现在开发者尝试的任务类型上。提及互操作性或逆向工程的公共仓库同比增长超过 300%,从 2025 年创建的约 30,000 个增至 2026 年的超过 130,000 个。  审查是开发者塑造返回结果的环节,为此正在构建更多工具。[堆叠拉取请求](https://docs.github.com/pull-requests/how-tos/stacked-pull-requests?utm_source=octoverse-pr-stacks-docs&utm_medium=blog&utm_campaign=universe-2026)将相关工作拆分为更小、便于按顺序审查的变更,于 7 月 30 日推出预览版,到 9 月已有超过 264,000 名开发者使用。AI 辅助代码审查和 GitHub Advanced Security 的使用量均同比增长超过 90%。该平台还帮助保护这些工作:推送保护会筛查 API 密钥和密码等泄露的机密,今年运行了 58 亿次扫描,接近 2025 年速度的四倍。开发者正在加大对代码审查方式的投入。 ## 模型选择以开发者的速度变化 开发者根据交给 Agent 的工作来匹配模型。2026 年 9 月,自行选择模型的 GitHub Copilot 用户中,61% 在会话中使用了不止一个模型,高于四个月前的 50%。 可选模型也在增多:付费 GitHub Copilot 计划上的开发者在 5 月使用了 29 个不同模型,9 月使用了 47 个,当月没有任何单一模型的请求占比超过 25%。一些模型选择取决于成本和熟悉度。开发者会权衡价格和功能与需求,并可能倾向于他们已经信任的提供商。  为了解开发者的选择如何分布,我们按用途对 GitHub Copilot 中使用的模型进行分组:深度推理与规划、通用、快速轻量。然后我们查看请求流向,仅统计开发者明确选择模型的活动。这排除了 GitHub Copilot 自行选择模型([自动模型选择](https://docs.github.com/copilot/concepts/models/auto-model-selection?utm_source=octoverse-auto-model-selection-docs&utm_medium=blog&utm_campaign=universe-2026))、GitHub 和 Microsoft 员工使用、后台实用模型、用于监控和测试的重复请求,以及使用开发者自己的 API 密钥发出的请求。 我们发现,在每 100 个开发者选择的请求中,38 个流向通用模型,37 个流向深度推理与规划模型,25 个流向快速轻量模型。开发者将选择分散在不同模型和功能上,约 25% 的请求流向快速模型。  为了解这些选择如何变化,我们将其视为过去三个月的时间序列,追踪请求份额以及尝试每个模型的开发者数量和持续回访的开发者数量。有三种模式尤为突出: - **大多数开发者尚未尝试新模型之前,新模型就已被大量使用。**在发布后的最初几周,大多数新模型所承接的请求份额,超过了尝试过它们的开发者所占比例。早期采用者会在其他人跟进之前大量使用某个模型。 - **开发者在减少对某个模型的依赖后,仍会将其保留在轮换使用中。**当某个模型的请求份额下降时,仍在使用它的开发者比例下降得更慢。 - **开发者会混合使用不同类型的模型。**请求分散在全部三类模型上,很少有开发者长期只使用某一类模型。 综合来看,跨模型类型的分布表明开发者做了大量选择:模型阵容持续扩大,最佳选择随任务不同而变化,三类模型都在轮换使用。许多开发者还让 GitHub Copilot 承担其中一部分工作。2026 年 9 月,63% 的付费 GitHub Copilot 开发者至少使用过一次[自动模型选择](https://github.blog/changelog/2026-09-14-configure-cost-and-quality-in-copilot-auto-model-selection/),让 Copilot 为任务挑选模型。 规划、实现和检查一项变更,各自对模型的能力、速度和成本提出了不同要求。[Project HydraFusion](https://github.blog/ai-and-ml/github-copilot/project-hydrafusion-frontier-quality-via-multi-model-orchestration/) 最初是模型编排的研究预览,将模型与这项工作的每个步骤相匹配。在 CLI 和 GitHub Copilot 应用中,它路由了近 60,000 个会话。这项工作现已作为 [GitHub Copilot Fusion](https://docs.github.com/copilot/concepts/models/copilot-fusion?utm_source=octoverse-fusion-docs&utm_medium=blog&utm_campaign=universe-2026) 正式可用,它将模型编排与自动模型选择结合在一起,在后台为每个步骤选择正确的模型。  ## 语言选择有了新的影响力 语言选择长期以来反映了开发者想构建什么、团队了解什么以及现有系统需要什么。今年的数据提出了一个问题:第四种影响力是否正在出现——当开发者没有指定语言时,智能体所选择的语言。 去年,我们报告称 TypeScript 已超越 Python 和 JavaScript,成为 GitHub 上贡献者使用最多的语言。这一排序在 2026 年保持不变,TypeScript 第一,Python 第二,JavaScript 第三。增长速度加快了。从 2025 年 9 月到 2026 年 9 月,TypeScript 新增 362 万月度贡献者,Python 新增 323 万,JavaScript 新增 182 万,是前 10 种语言中增幅最大的。按百分比计算,Rust 在前列语言中增长最快,过去一年翻了一番。 我们的预测延续了近期趋势:到 2027 年 9 月,TypeScript 和 Python 的月度贡献者将各自接近 1300 万,JavaScript 为 740 万,前 10 名中的其他语言均低于约 220 万。  增长最快的语言也是 AI 出现最多的语言。我们将每种语言过去一年的社区增长与其合并拉取请求中检测到 AI 参与的份额进行了对照,气泡大小大致表示每种语言社区的规模。TypeScript、Python 和 Rust 是增长最快的社区,其份额也最高,约 40% 到 44% 的合并拉取请求涉及 AI。Java、C# 和 C++ 较低,约在 21% 到 34% 之间,不过在所示的所有语言中,每五个合并拉取请求中就有一个以上涉及 AI。  仓库数据提供了另一个视角。在 2026 年创建的仓库中,有可观察到的 agent 信号的仓库里,TypeScript 作为主要语言的比例为 35%,而没有 agent 信号的仓库中这一比例为 24%。对于 2026 年之前创建的仓库,差距类似:有 agent 信号的为 27%,没有的为 17%。这表明与 agent 打交道的开发者倾向于使用那些 agent 输出更容易检查的语言。清楚知道自己想要什么的开发者仍然会指定语言。但当他们把选择权留空时,agent 似乎会偏向更窄的一组语言,其中 TypeScript 居首。 ## 什么在吸引开发者的注意力 今年,我们将 GitHub 上增长最快、参与度最高的项目分为两组:社区与独立仓库,以及单一厂商或产品主导的仓库。社区与独立项目由基金会治理、广泛维护,或由个人领导且没有明确的商业赞助方。单一厂商和产品主导的项目是开源或源码可用的,通常也会接受大量社区贡献,但战略控制权掌握在一家公司手中。 综合来看,这两份榜单显示出一种分工。社区一侧主要是支撑其他一切的基础设施:像 vLLM、SGLang 和 llama.cpp 这样的推理引擎,像 PyTorch 这样的框架,像 Rust 和 CPython 这样的语言与运行时,以及像 Home Assistant 和 Godot 这样的平台。厂商一侧主要是开发者直接使用的工具:编码 agent、编辑器以及围绕它们的编排工具。贡献者在两个层面都有参与。增长榜单还包括一些专为欢迎新人而建的地方,比如 first-contributions 和 is-a-dev/register,许多开发者在那里提交了他们的第一个 pull request。 ##### 今年按贡献者数量增长最快的仓库 | **排名** | **社区 / 独立** | **单一厂商 / 产品主导** | | --- | --- | --- | | 1 | farion1231/cc-switch | Anthropic: anthropics/claude-code | | 2 | punkpeye/awesome-mcp-servers | OpenAI: openai/codex | | 3 | Omacom Foundation: omacom/omarchy | Anomaly: anomalyco/opencode | | 4 | firstcontributions/first-contributions | Microsoft: microsoft/vscode | | 5 | ggml-org/llama.cpp | GitHub: github/copilot-cli | | 6 | Eclipse Foundation: EclipseFdn/open-vsx.org | Zed Industries: zed-industries/zed | | 7 | sgl-project/sglang | Google: google-gemini/gemini-cli | | 8 | vllm-project/vllm | BerriAI: BerriAI/litellm | | 9 | imputnet/helium | microsoft/winget-pkgs | | 10 | vllm-project/vllm-ascend | Kilo-Org/kilocode | ##### 参与度最高的开源仓库 | **排名** | **社区 / 独立** | **单一厂商 / 产品主导** | | --- | --- | --- | | 1 | OpenClaw Foundation: openclaw/openclaw | Nous Research: NousResearch/hermes-agent | | 2 | vllm-project/vllm | Anomaly: anomalyco/opencode | | 3 | ggml-org/llama.cpp | Earendil: earendil-works/pi | | 4 | Omacom Foundation: omacom/omarchy | Stably AI: stablyai/orca | | 5 | farion1231/cc-switch | Ping: pingdotgg/t3code | | 6 | sgl-project/sglang | Microsoft: microsoft/vscode | | 7 | PyTorch Foundation: pytorch/pytorch | Graphify Labs: Graphify-Labs/graphify | | 8 | Rust Foundation: rust-lang/rust | Paperclip AI: paperclipai/paperclip | | 9 | Open Home Foundation: home-assistant/core | BerriAI: BerriAI/litellm | | 10 | Python Software Foundation: python/cpython | can1357/oh-my-pi | ## 不变的是什么 作为今年研究的一部分,我们还统计了开发者在各自代码库中最常使用的 emoji。在我们考察的每一个行业中,火箭 🚀 都以巨大优势位居榜首。它恰如其分地象征了这充满动能的一年。今年,GitHub 上的开发者涉足了更广阔的领域:比以往任何时候都更多的代码、更多的国家和更多的行业。但这一切活动都没有改变由谁来决定代码应该做什么。仍然需要有人提出想法,无论是[评估地震风险的软件](https://github.com/gem/oq-engine)、[在线服务如何更改其条款和隐私政策的公开记录](https://github.com/opentermsarchive/engine),还是[让 AI 像穴居人一样回答以节省字数的 agent 技能](https://github.com/JuliusBrussee/caveman)。也仍然需要有人来决定它是否可行、是否该被纳入,以及它是否足够好。 真正改变的是,把一个周末的灵光一现变成现实变得容易了许多。 工具会不断变化,新的行业会不断在我们意想不到的地方出现。开发者选择构建什么、为谁构建,仍然由他们自己决定。火箭 emoji 以及一切皆是如此。 * * * ## 术语表 - **Agent 配置文件:**用于设置或指导 AI 编码 agent 的代码库文件。也称为 AI 配置文件或 agentic 文件。没有该文件的代码库仍可使用 AI。 - **Agent 信号:**在遥测数据中观察到的 agent 参与迹象,例如由 agent 打开的拉取请求。这是一个下限,因为并非所有 agent 使用都能被检测到。 - **Agent 发起的拉取请求:**其初稿来自我们可检测到的编码 agent 的拉取请求。 - **自动模型选择:**GitHub Copilot 的一项设置,由 Copilot 为任务挑选模型。 - **提交:**代码库更改的已保存快照。 - **贡献:**活动事件:对提交、议题、拉取请求或讨论发表评论;创建 gist、议题、拉取请求或讨论;推送代码;以及审查拉取请求。每次推送计为一次,无论其中包含多少次提交。开源贡献是指对公开和开源代码库的贡献。 - **贡献者:**在该时间段内至少有一次贡献的 GitHub 用户。 - **Copilot 云 agent:**GitHub Copilot 的一项功能,开发者分配任务后,由 agent 独立完成。 - **Dependabot:**GitHub 的自动化工具,用于发现过时或存在漏洞的依赖项,并打开拉取请求进行更新。 - **开发者选择的请求:**由我们代理、且由开发者选择模型的模型请求。它不包括自动模型选择、员工使用、重复的监控和测试请求、后台实用模型,以及使用开发者自己的 API 密钥发出的请求。 - **GitHub Actions 作业:**GitHub Actions 工作流中的单个工作单元。 - **GitHub Advanced Security:**GitHub 的应用安全功能套件,包括代码扫描、机密扫描和依赖项审查。 - **NAICS:**北美行业分类系统,今年用于按行业对公开代码库进行分类的标准行业分类法。 - **Project HydraFusion:**GitHub 的模型编排研究预览版,它跨模型规划任务,例如一个模型起草、另一个模型审查,并在需要时由能力更强的模型介入。现已作为 GitHub Copilot Fusion 正式可用。 - **推送(Push):**将已保存的更改发送到 GitHub。一次推送可以包含多个提交。 - **堆叠式拉取请求(Stacked pull requests):**一种评审工作流,将相关工作拆分为一系列较小的拉取请求,并按顺序进行评审。 ## 方法论 - **范围与时间窗口。**Octoverse 年度统计期为 2025 年 10 月 1 日至 2026 年 9 月 30 日(含首尾)。除非另有说明,指标涵盖公开和私有仓库。行业、开源贡献和开源项目数据仅限公开仓库。往年数据:2024 年和 2025 年的数据按相同定义和时间窗口重新计算,因此可能与早期报告存在差异,早期报告仅涵盖公开活动,且时间窗口为 9 月 1 日至 8 月 31 日。 - **推送、提交与贡献。**一次推送会将一个或多个提交发送到 GitHub。贡献数对每次推送只计一次,因此提交总数可能超过贡献总数。Actions 按作业(job)计数,而非按分钟计数。开源贡献(25 亿)为公开数据。 - **过滤。**贡献者和贡献计数在可识别的情况下排除被标记为垃圾信息的账户、员工和机器人。 - **地理与预测。**开发者按自报位置映射到国家/地区,发布阈值为 100 名开发者。Octoverse 2025 发布的是 2030 年总量,而非年度目标。进展指 2025 年 9 月至 2026 年 9 月净增开发者数,占各国已发布的 2025 年数量到其 2030 年预测值之间距离的比例。 - **语言。**贡献者指每月通过推送、拉取请求、议题、评审或评论参与的去重账户,按各仓库的主要语言(Linguist)归属。一个账户可计入多种语言。此方法沿用 Octoverse 2025 的做法。预测覆盖按月均参与度排名前 10 的语言,并预测至 2027 年 9 月(显示均值)。 - **语言气泡图**比较了 2025 年 9 月至 2026 年 9 月间月度参与账户的增长,与检测到 AI 参与的已合并拉取请求占比之间的关系。气泡大小反映社区规模。 - **按对公开仓库的推送量排名的国家/地区(按个人资料位置调整)。**各国推送量按 Octoverse 年度汇总。为校正 VPN 使用带来的偏差,使用 LLM 分类从该期间有推送贡献的 GitHub 用户个人资料中提取 ISO 3166-1 alpha-2 代码,再据此构建基于个人资料位置的 ISO 3166-1 alpha-2 代码与基于 IP 地址的 ISO 3166-1 alpha-2 代码之间的比率。随后用这些比率对各国推送量进行加权。 - **行业。**2022 至 2026 年创建的公开仓库,通过微调的多语言嵌入模型,依据名称、描述、主题和 README,从每年的随机样本中归类到 NAICS 行业部门。AI 提及和由智能体开启的拉取请求(仅限可检测的智能体)被标记为单独信号。行业部门占比与 AI 提及占比可能相关,因为二者读取的是同一文本。占比为估算值。 - **开源排名。**仓库按谁掌握战略控制权分为社区型或单一供应商型。“增长最快”按去重贡献账户的同比绝对增量排名。“参与度最高”综合仓库在星标、复刻以及去重拉取请求和议题创建者方面的排名。复刻的仓库不列入这两个榜单。 - **模型选择。**数据涵盖 GitHub Copilot,且仅统计开发者主动选择的请求。不包含自动模型选择、员工使用、重复的监控请求、后台实用模型,以及使用开发者自有 API 密钥发起的请求。每个模型需至少有 1,000 名周活跃用户才计入统计。模型按其用途分组,示例按提供商字母顺序列出: - **深度推理与规划:**Claude Opus 5.5、GPT 5.5。 - **通用:**Claude Sonnet 5、Grok 4.7、GPT 6.1 Sol。 - **快速轻量:**Claude Haiku 5.5、Gemini 3.8 Flash、GPT 6 Luna。 - 数据描述的是实际观测到的使用情况,而非模型质量。趋势观察使用 2026 年 7 月 14 日至 10 月 13 日的周度数据。 - **请求份额**指截至 2026 年 10 月 13 日的 7 天周期内,各模型组占所有符合条件请求的比例。 - **互操作性。**统计每年创建的公开仓库,其名称、描述、主题或 README 中提及互操作性或逆向工程,或相关术语,例如净室实现、直接替换或协议重新实现。 - **预测。**我们对历史 GitHub 数据、注册量、产品使用情况和市场规模运行了 43 个时间序列和回归模型,预测 GitHub 上的开发者数量到 2031 年 9 月相对于 2026 年 9 月的变化。结果分为 3 倍或以上(21 个模型)、2 倍至不足 3 倍(19 个)以及不足 2 倍(3 个)。Octoverse 2025 使用了五个模型。没有预测是完全准确的。 文章 [Octoverse:2026 年开发者借助智能体构建,提交、推送与覆盖范围均创新高](https://github.blog/news-insights/octoverse/octoverse-commits-pushes-reach-new-highs-in-2026-as-developers-build-with-agents/) 首次发布于 [The GitHub Blog](https://github.blog/)。 ## 正文 · 原文 Developers pushed code to GitHub 17.9 billion times in the past 12 months, more than in 2024 and 2025 combined. Behind that number are developers building what interests them and what their communities need. In Nepal, one developer [built a flood bulletin on GitHub Pages](https://github.com/nirajbhusal/rasuwa-flood-bulletin) with verified information on roads, rescue, weather, and power. It has since grown into [Gati](https://github.com/nirajbhusal/gati-alerts), a Nepali-first relay of official disaster alerts that runs on GitHub Pages and Actions. Elsewhere, developers at NASA’s Jet Propulsion Laboratory are creating [software designed to run programs aboard spacecraft](https://github.com/nasa/spacewasm), and fans [built open-source firmware that lets people customize their e-readers](https://github.com/crosspoint-reader/crosspoint-reader). Curiosity, aimed in every direction, at a scale GitHub hasn’t seen before. That growth happened quickly. Partway through the year, activity on GitHub bent sharply upward, just as agents went from something developers were trying out to something they were working alongside. Developers picked from more models than ever and built in industries we are highlighting in this report for the first time, from health care to agriculture. Octoverse is our chance to step back and look at the whole picture. This year, that picture is bigger than ever. Here is what stood out most: - **More AI, more of everything.** Among repositories created this year, the average repo with an agent configuration file logged eight times as many commits as the average new repo without one. - **As of September, developers start more than 40% of pull requests with an agent.** In March, it was 17%. For a growing share of work, the first move is now directing an agent, and review is how developers shape what comes back. - **Developers move fast on model choice.** In September, 61% of GitHub Copilot users used more than one model, and requests spread across general purpose, deep reasoning and planning, and fast and lightweight models - **Builders are showing up from every field.** This year, for the first time, we’re sharing our view of public repositories by industry. Repos serving mining, construction, health care, and agriculture have each grown several times over since 2022. Underneath it all, AI models and the harnesses built around them have advanced over the past year, and developers have more to choose from. Growth is moving quickly: one year into last year’s five-year developer growth projections, every country we projected has already closed at least a fifth of its distance to 2030, and our own forecasting models no longer agree on where it will go next. ## The year developers set a new pace  This year was all about momentum. Developers pushed code changes to GitHub 17.9 billion times in the past 12 months, more than 2024 and 2025 combined. Commits across all repo types (public and private) climbed even faster to 34.3 billion, more than three times where they stood two years ago. Merged pull requests more than tripled to 1.3 billion over the same period, an average of 3.5 million a day. Agents were one of the tools developers leaned on hardest this year, pulling them deeper into daily work. Among repos created this year, the average repo with an agent configuration file logged eight times as many commits as the average new repo without one, sign that individuals and teams building with agents from day one are moving at a markedly different pace. Developers also relied on automations to keep projects moving. GitHub Actions ran a job 1,440 times every second this year. This equals 124 million times a day and is more than three times last year’s total. Developers merged more than 30 million Dependabot pull requests to keep dependencies current and reduce the use of known vulnerabilities, about double 2025’s pace.  Our telemetry shows activity climbing steadily from January, then surging around June, as if developers everywhere saw new possibilities at once. Right around then, a cluster of industry-wide shifts landed: better underlying models, the harnesses and tools built around them, and the agents running on both. Agents moved from single-session tools to persistent ones that could track progress across days and orchestrate other specialized agents. Just as important, agents began making extensive use of the cloud, executing work remotely as well as on local machines.  This momentum is showing up both in brand-new repos and from developers who have been building for years. From June onwards, about 55% of all commits came from brand new repositories. But plenty more commits came from developers who’ve been around a while: developers who pushed code in the past 12 months have been on GitHub for an average of 36 months, and of those who opened a pull request in August, more than 75% pushed code in September. They are also branching out: the average developer now works across 10% more repositories than they did a year ago. That staying power shows up in open source too. Public contributions soared to 2.5 billion in 2026, more than double last year’s total (1.12 billion). Behind those numbers are developers who keep showing up, like [@kinlane,](https://github.com/kinlane) who made more than 1 million contributions across his public repositories using agentic workflows to keep a machine-readable catalog of public API information current. Another example is [@kim-em](https://github.com/kim-em), who made more than 178,000 contributions while maintaining mathlib, which is a community library of computer-checked mathematics. [@andig](https://github.com/andig), a maintainer of the open source EV charging controller and home energy management system [evcc](https://github.com/evcc-io/evcc), contributed over 21,000 times. These are just a few examples of the work millions of developers do every day. To all the developers doing work like this and beyond: we see you, and we’re glad you’re building. ## Developers are building from more places Behind every number in this report is a developer. GitHub now serves more than 225 million of them, and the community is growing around the globe. The United States (38.3 million) and India (32 million) remain the two largest developer communities, and each added more than 10 million developers this year. Brazil added 3.28 million developers on GitHub this year, the third most of any country. | **Country** | **Total number of developers on GitHub in Sept. 2026** | | --- | --- | | United States | 38.3 M | | India | 32.0 M | | China | 12.4 M | | Brazil | 10.2 M | | Japan | 7.15 M | | United Kingdom | 6.47 M | | Indonesia | 6.34 M | | Germany | 6.30 M | | Russia | 5.07 M | | France | 4.75 M | Last year, we projected that India would reach 57.5 million developers by 2030 and the United States 54.7 million. One year into that five-year window, every country in our projections has already closed at least a fifth of the distance to its own 2030 figure. The United States has closed 38.6%, and India 28.3%.  The same momentum shows up across regions, each with its own local context: | **Region** | **Growth driver** | **Market context** | | --- | --- | --- | | Americas | Fintech and digital payments | • **Brazil**: mature, fast-growing fintech sector
• **Canada**: steady AI and software investment | | EMEA | AI adoption in manufacturing and startups. Fast-growing developer community in Africa | • **Morocco**: fintech and startup scene
• **Germany**: enterprise AI adoption across its industrial heartland
• **France and Spain**: AI and deep-tech startups
• **Kenya, Nigeria, South Africa**: fintech, agritech, and coding bootcamps | | APAC | Government investment in AI infrastructure and talent | • **Indonesia**: booming digital economy
• **Japan**: AI infrastructure investment
• **South Korea**: government-backed AI talent programs
• **Australia**: AI, machine learning, and data skills | One year in, growth is strong against last year’s projection, and projecting the next five years is getting harder. We ran more than 40 forecasting models forward to 2031, time-series and regression models built on historical sign-up and usage data, each assuming a different pace of growth. About half call for “extreme” growth, with developer counts on GitHub more than tripling by 2031. Just under half call for “substantial” growth, doubling to tripling. Only three models expect anything close to modest, under 2x growth.  Forecasts are estimates, and a spread this wide shows how much the 2026 surge widened what is plausible by 2031. What holds steady is the shape of the trend: a developer community growing in more places at once. ## The future is being built everywhere In past reports, “everywhere” meant more developers and more countries, such as in the context of the top countries contributing code to public repositories: ##### Top 10 countries by pushes to public repositories, adjusted by profile location | **Rank** | **Country** | | --- | --- | | 1 | United States | | 2 | India | | 3 | China | | 4 | Brazil | | 5 | Germany | | 6 | United Kingdom | | 7 | Korea | | 8 | France | | 9 | Japan | | 10 | Canada | This year, it also means more fields, including industries we haven’t measured before. We’re sharing our view of public repositories by industry using the North American Industry Classification System (NAICS), which sorts economic activity into sectors. A language model classified random samples of public repositories created each year from 2022 to 2026, assigning each to the industry it serves based on its name, description, topics, and README. We also tracked two signals: whether a repository mentions AI, and whether an agent opened a pull request against it. The two signals do not always move together. In administrative and support services, mining, health care, and agriculture, more than four in 10 repositories mention AI, yet agent-opened pull requests are rare, less than 3 percent. Construction breaks that pattern. About a quarter of its repositories mention AI, but about 9 percent have agent-opened pull requests, the highest share of any sector, with manufacturing next.  The same classification shows how each industry’s footprint has shifted since 2022, and sectors well beyond software are climbing. Professional, scientific, and technical services rose from fourth to second place among all industries, behind only information. Agriculture, forestry, fishing and hunting climbed two spots, and finance and insurance and health care and social assistance each moved up one. Against each sector’s own 2022 baseline, mining, quarrying, and oil and gas extraction grew roughly 65 times from a small starting base, administrative and support services and construction 17 to 18 times, and even manufacturing, the slowest of these, almost tripled.  Behind these sector shifts are people who know their fields, now using AI coding agents to build. For example, in manufacturing, a small team built a way to [turn a photo of your tools into a custom-fit, 3D-printable drawer organizer](https://github.com/tracefinity/tracefinity). A research lab in health care made it easier for scientists to [analyze huge digital scans of tissue samples](https://github.com/rendeirolab/wsidata), the kind pathologists study to understand disease. In Copenhagen, a university lab built a [pipeline that classifies video of chickens at play, from frolicking to worm chasing](https://github.com/sbhattlab/PlayClass). A University of Waikato energy center built a [toolkit that helps industrial plants find heat they can reuse](https://github.com/waikato-ahuora-smart-energy-systems/OpenPinch), and Bulgaria’s digital ministry open-sourced a [portal where anyone can trace who won a public contract and for how much](https://github.com/midt-bg/sigma). For writers, a novelist built a [free app that makes a manuscript look like a book as you type](https://github.com/hughhowey/neo). In field after field, the people closest to the problem are building the solution, with agents helping along the way. Professional, scientific, and technical services, which grew about 5 times over its own 2022 baseline and climbed to second place, is the work of researching, engineering, and advising, and open code has long been part of how that work gets done. In biochemistry, the work behind [AlphaFold](https://github.com/google-deepmind/alphafold) earned Demis Hassabis and John Jumper a share of the 2024 Nobel Prize in Chemistry. In computer science, [Tensor2Tensor](https://github.com/tensorflow/tensor2tensor) accompanied the paper that introduced the Transformer, the architecture behind today’s large language models, [“Attention Is All You Need.”](https://arxiv.org/abs/1706.03762) In medicine, [sars-cov-2-stability](https://github.com/dylanhmorris/sars-cov-2-stability) held the code and data behind one of the earliest papers on how long the virus survives in the air and on surfaces. In physics, [eht-imaging](https://github.com/achael/eht-imaging) was one of two open-source libraries used to reconstruct the [first image of a black hole](https://arxiv.org/abs/1906.11241). A repository has quietly become part of the paper trail behind published research. ## Developers are reshaping their workflow More developers now begin a pull request by specifying what they want and orchestrating the agents that carry it out. By September 2026, more than 40% of pull requests on GitHub started with an agent’s first draft, up from 17% in March. That is 110 million in September alone, about 6x March’s volume.  Agent-started pull requests also more often change multiple files: about 87%, compared with 79% of pull requests without detected agent involvement. They are landing quickly too. In February, 83% of agent-involved pull requests merged within two weeks, a touch behind the roughly 86% for pull requests without detected agent involvement. By September, agent pull requests were at 90%, while the comparison group held at about 86%.  Among GitHub Copilot’s monthly active users, 55% now use agentic features, up from 35% a year ago. The steepest growth is in the most hands-off mode. Copilot cloud agent, where a developer assigns a task and an agent works on it independently, grew 230% year over year, against 85% for agent chat. Developers still ask agents questions, and increasingly they hand over whole tasks. The willingness to delegate is reflected by the kinds of tasks developers are attempting. Public repositories mentioning interoperability or reverse engineering increased more than 300% year over year, from about 30,000 created in 2025 to more than 130,000 in 2026.  Review is where developers shape what comes back, and more tooling is being built for it. [Stacked pull requests](https://docs.github.com/pull-requests/how-tos/stacked-pull-requests?utm_source=octoverse-pr-stacks-docs&utm_medium=blog&utm_campaign=universe-2026), which split related work into smaller changes that are easier to review in sequence, launched as a preview on July 30, and more than 264,000 developers had used them by September. Usage of AI-assisted code review and GitHub Advanced Security both grew more than 90% year over year. The platform also helps secure that work: push protection, which screens for exposed secrets such as API keys and passwords, ran 5.8 billion scans this year, nearly four times 2025’s pace. Developers are investing in how they review code. ## Model choice moves at developer speed Developers match models to the work they hand to their agents. In September 2026, 61% of GitHub Copilot users who selected a model themselves used more than one model across their sessions, up from 50% four months earlier. The lineup is growing too: developers on paid GitHub Copilot plans used 29 distinct models in May and 47 in September, and no single model carried more than 25% of requests that month. Some model decisions come down to cost and familiarity. Developers weigh price and functionality against need and may lean toward providers they already trust.  To see how developer choices spread, we grouped the models used in GitHub Copilot by what they are built for: deep reasoning and planning, general purpose, and fast and lightweight. We then looked at where requests went, counting only activity where a developer explicitly selected a model. That leaves out cases where GitHub Copilot picks the model ([auto model selection](https://docs.github.com/copilot/concepts/models/auto-model-selection?utm_source=octoverse-auto-model-selection-docs&utm_medium=blog&utm_campaign=universe-2026)), GitHub and Microsoft staff usage, background utility models, duplicate requests used for monitoring and testing, and requests made with a developer’s own API key. We found that out of every 100 developer-selected requests, 38 went to general purpose models, 37 to deep reasoning and planning models, and 25 to fast and lightweight models. Developers spread their choices across models and functionality, and about 25% of requests go to a fast model.  To see how those choices shift, we looked at them as a time series over the past three months, tracking request share alongside how many developers tried each model and how many kept coming back. Three patterns stand out: - **New releases are used heavily before most developers have tried them.** In their first weeks, most new models take a larger share of requests than the portion of developers who have tried them. Early adopters use a model heavily before the rest follow. - **Developers keep a model in rotation after leaning on it less.** When a model’s share of requests falls, the share of developers still using it falls more slowly - **Developers blend kinds of models.** Requests spread across all three groups, and few developers stay with any one kind for long. Taken together, the spread across kinds of models points to a lot of choosing: a lineup that keeps growing, a best fit that shifts from one task to the next, and all three kinds of models held in rotation. Many developers also let GitHub Copilot do some of it. In September 2026, 63% of paying GitHub Copilot developers used [auto model selection](https://github.blog/changelog/2026-09-14-configure-cost-and-quality-in-copilot-auto-model-selection/) at least once, letting Copilot pick the model for the task. Planning, implementing, and checking a change each place different demands on a model, in capability, speed, and cost. [Project HydraFusion](https://github.blog/ai-and-ml/github-copilot/project-hydrafusion-frontier-quality-via-multi-model-orchestration/), began as a research preview of model orchestration, matching models to each step of that work. In the CLI and the GitHub Copilot app, it routed almost 60,000 sessions. That work is now generally available as [GitHub Copilot Fusion](https://docs.github.com/copilot/concepts/models/copilot-fusion?utm_source=octoverse-fusion-docs&utm_medium=blog&utm_campaign=universe-2026), which brings model orchestration together with auto model selection and chooses the right model for each step behind the scenes.  ## Language choice has new influence Language choice has long reflected what developers want to build, what their teams know, and what existing systems require. This year’s data raises the question of whether a fourth influence is emerging: the language an agent picks when a developer doesn’t specify one. Last year, we reported that TypeScript had overtaken Python and JavaScript to become the most used language on GitHub by contributors. That order held in 2026, with TypeScript first, Python second, and JavaScript third. The pace picked up. From September 2025 to September 2026, TypeScript added 3.62 million monthly contributors, Python 3.23 million, and JavaScript 1.82 million, the largest gains among the top 10 languages. Rust grew fastest by percentage among the top languages, doubling in the past year. Our forecasts extend recent trends: TypeScript and Python near 13 million monthly contributors each by September 2027, JavaScript at 7.4 million, and every other language in the top 10 below about 2.2 million.  The languages growing fastest are also where AI shows up most. We charted each language’s community growth over the past year against the share of its merged pull requests with detected AI involvement, with bubbles roughly sized to show the size of each language’s community. TypeScript, Python, and Rust, the fastest-growing communities, have the highest shares, about 40% to 44% of merged pull requests. Java, C#, and C++ sit lower, between about 21% and 34%, though AI shows up in more than one in five merged pull requests in every language shown.  The repository data adds another angle. Among repositories created in 2026, TypeScript was the primary language in 35% of those with an observed agent signal, compared to 24% without one. For repositories created before 2026, the gap was similar: 27% with an agent signal, versus 17% without. That suggests developers who work with agents gravitate toward languages where agent output is easier to check. Developers who know exactly what they want still specify the language. But when they leave the choice open, agents appear to favor a narrower set of languages, TypeScript chief among them. ## What is capturing developer attention This year, we split the fastest-growing and most-engaged projects on GitHub into two groups: community and independent repositories, and single-vendor or product-led ones. Community and independent projects are foundation-governed, broadly maintained, or led by an individual without a clear commercial sponsor. Single-vendor and product-led projects are open source or source-available and often take substantial community contributions, but strategic control sits with one company. Read together, the two lists show a division of labor. The community side is mostly the foundation underneath everything else: inference engines like vLLM, SGLang, and llama.cpp, frameworks like PyTorch, languages and runtimes like Rust and CPython, and platforms like Home Assistant and Godot. The vendor side is mostly the tools developers work with directly: coding agents, editors, and the orchestration around them. Contributors are showing up for both layers. The growth list also includes places built to welcome newcomers, like first-contributions and is-a-dev/register, where many developers make their first pull request. ##### This year’s fastest-growing repositories by contributors | **Rank** | **Community / independent** | **Single vendor / product-led** | | --- | --- | --- | | 1 | farion1231/cc-switch | Anthropic: anthropics/claude-code | | 2 | punkpeye/awesome-mcp-servers | OpenAI: openai/codex | | 3 | Omacom Foundation: omacom/omarchy | Anomaly: anomalyco/opencode | | 4 | firstcontributions/first-contributions | Microsoft: microsoft/vscode | | 5 | ggml-org/llama.cpp | GitHub: github/copilot-cli | | 6 | Eclipse Foundation: EclipseFdn/open-vsx.org | Zed Industries: zed-industries/zed | | 7 | sgl-project/sglang | Google: google-gemini/gemini-cli | | 8 | vllm-project/vllm | BerriAI: BerriAI/litellm | | 9 | imputnet/helium | microsoft/winget-pkgs | | 10 | vllm-project/vllm-ascend | Kilo-Org/kilocode | ##### The most-engaged open-source repositories | **Rank** | **Community / independent** | **Single vendor / product-led** | | --- | --- | --- | | 1 | OpenClaw Foundation: openclaw/openclaw | Nous Research: NousResearch/hermes-agent | | 2 | vllm-project/vllm | Anomaly: anomalyco/opencode | | 3 | ggml-org/llama.cpp | Earendil: earendil-works/pi | | 4 | Omacom Foundation: omacom/omarchy | Stably AI: stablyai/orca | | 5 | farion1231/cc-switch | Ping: pingdotgg/t3code | | 6 | sgl-project/sglang | Microsoft: microsoft/vscode | | 7 | PyTorch Foundation: pytorch/pytorch | Graphify Labs: Graphify-Labs/graphify | | 8 | Rust Foundation: rust-lang/rust | Paperclip AI: paperclipai/paperclip | | 9 | Open Home Foundation: home-assistant/core | BerriAI: BerriAI/litellm | | 10 | Python Software Foundation: python/cpython | can1357/oh-my-pi | ## What doesn’t change As part of our research this year, we also tracked the emoji developers used most in their repositories. Across every industry we looked at, the rocket 🚀 topped the list, by a wide margin. A fitting symbol for a year of momentum. Developers on GitHub covered more ground this year: more code, more countries, and more industries than we’ve ever measured. None of that activity changes who decides what the code should do. Someone still has to come up with the idea, whether it’s [software that assesses earthquake risk](https://github.com/gem/oq-engine), [an open record of how online services change their terms and privacy policies](https://github.com/opentermsarchive/engine), or [an agent skill that makes an AI answer like a caveman to save on words](https://github.com/JuliusBrussee/caveman). And someone still has to decide whether it works, whether it belongs, and whether it’s good. What did change is how much easier it is to take an idea from a weekend thought to something real. The tools will keep changing, and new industries will keep showing up in places we didn’t expect. What a developer chooses to build, and who they build it for, is still theirs to decide. Rocket emoji and all. * * * ## Glossary - **Agent configuration file:** A repository file that sets up or directs an AI coding agent. Also called an AI configuration file or agentic file. Repositories without one may still use AI. - **Agent signal:** An observed sign of agent involvement in telemetry, such as an agent-opened pull request. It is a floor, since not all agent use may be detected. - **Agent-started pull request:** A pull request whose first draft came from a coding agent that we can detect. - **Auto model selection:** A GitHub Copilot setting where Copilot picks the model for the task. - **Commit:** A saved snapshot of changes to a repository. - **Contributions:** Activity events: commenting on a commit, issue, pull request, or discussion; creating a gist, issue, pull request, or discussion; pushing code; and reviewing a pull request. Each push counts once, however many commits it holds. Open-source contributions are contributions to public and open source repositories. - **Contributors:** GitHub users with at least one contribution in the period. - **Copilot cloud agent:** A GitHub Copilot feature where a developer assigns a task and an agent works on it independently. - **Dependabot:** GitHub’s automated tool that finds outdated or vulnerable dependencies and opens pull requests to update them. - **Developer-selected request:** A model request where we proxied the developer chose the model. It excludes auto model selection, staff usage, duplicate monitoring and testing requests, background utility models, and requests made with a developer’s own API key. - **GitHub Actions job:** A single unit of work in a GitHub Actions workflow. - **GitHub Advanced Security:** GitHub’s suite of application security features, including code scanning, secret scanning, and dependency review. - **NAICS:** The North American Industry Classification System, the standard sector taxonomy used this year to classify public repositories by industry. - **Project HydraFusion:** A GitHub research preview of model orchestration, which plans a task across models, such as one drafting, another reviewing, and a more capable one stepping in when needed. Now generally available as GitHub Copilot Fusion. - **Push:** Sending saved changes to GitHub. One push can carry many commits. - **Stacked pull requests:** A review workflow that splits related work into a sequence of smaller pull requests that are reviewed in order. ## Methodology - **Scope and window.** The Octoverse year runs October 1, 2025 to September 30, 2026, inclusive. Unless noted, metrics include public and private repositories. Industry, open-source contribution, and open-source project figures are public only. Prior years: 2024 and 2025 figures are recalculated on the same definitions and window, so they may differ from earlier reports, which covered public activity and a September 1 to August 31 window. - **Pushes, commits, and contributions.** A push sends one or more commits to GitHub. Contributions count each push once, so commit totals can exceed contribution totals. Actions are counted in jobs, not minutes. Open-source contributions (2.5 billion) are public. - **Filtering.** Contributor and contribution counts exclude spam-flagged accounts, staff, and bots where identifiable. - **Geography and projections.** Developers are mapped to countries by self-reported location, with a 100-developer publication threshold. Octoverse 2025 published 2030 totals, not annual targets. Progress is net developers added from September 2025 to September 2026 as a share of the distance from each country’s published 2025 count to its 2030 projection. - **Languages.** Contributors are distinct accounts each month that took part through pushes, pull requests, issues, reviews, or comments, attributed to each repository’s primary language (Linguist). An account can count in several languages. This follows the Octoverse 2025 method. Forecasts cover the top 10 languages by average monthly participation and project to September 2027 (mean shown). - The **language bubble chart** compares growth in monthly participating accounts between September 2025 and September 2026 with the share of merged pull requests with detected AI involvement. Bubble size reflects community size. - **Top countries by pushes to public repositories, adjusted by profile location.** Pushes from each country were summed across the Octoverse year. To adjust for biases caused by VPN usage, LLM classification was used to extract the ISO 3166-1 alpha-2 code from the profiles of GitHub users who contributed pushes during this period, which were then used to construct ratios of ISO 3166-1 alpha-2 codes based on profile location vs. ISO 3166-1 alpha-2 codes based on IP address. These ratios were then used to weight the pushes from each country. - **Industry.** Public repositories created 2022 to 2026 were sorted into NAICS sectors by a fine-tuned multilingual embedding model using name, description, topics, and README, from random samples per year. AI mentions and agent-opened pull requests (detectable agents only) were flagged as separate signals. Sector and AI-mention shares can be related because both read the same text. Shares are estimates. - **Open-source rankings.** Repositories are classed as community or single-vendor by who holds strategic control. “Fastest-growing” ranks by the absolute year-over-year increase in distinct contributing accounts. “Most engaged” blends a repository’s rankings for stars, forks, and distinct pull request and issue creators. Forked repositories are excluded from both lists. - **Model choice.** Figures cover GitHub Copilot and count developer-selected requests only. They exclude auto model selection, staff usage, duplicate monitoring requests, background utility models, and requests made with a developer’s own API key. Each model needs at least 1,000 weekly active users to count. Models are grouped by what they are built for, with examples listed alphabetically by provider: - **Deep reasoning and planning:** Claude Opus 5.5, GPT 5.5. - **General purpose:** Claude Sonnet 5, Grok 4.7, GPT 6.1 Sol. - **Fast and lightweight:** Claude Haiku 5.5, Gemini 3.8 Flash, GPT 6 Luna. - Figures describe observed use, not model quality. Trend observations use weekly data from July 14 to October 13, 2026. - **Request share** is the share of all qualifying requests per model group in a 7-day period ending October 13, 2026. - **Interoperability.** Counts public repositories created each year whose name, description, topics, or README mention interoperability or reverse engineering, or related terms, such as clean room implementation, drop-in replacement, or protocol re-implementation. - **Forecasts.** We ran 43 time-series and regression models on historical GitHub data, sign-ups, product usage, and market sizing, projecting developers on GitHub to September 2031 relative to September 2026. Outcomes group as 3x or more (21 models), 2x to under 3x (19), and under 2x (3). Octoverse 2025 used five models. No forecast is perfectly accurate. The post [Octoverse: Commits, pushes, reach new highs in 2026 as developers build with agents](https://github.blog/news-insights/octoverse/octoverse-commits-pushes-reach-new-highs-in-2026-as-developers-build-with-agents/) appeared first on [The GitHub Blog](https://github.blog/).